XF 1600 IFU 5.0 en.pdf
Vista previa de texto
Chapter 9
Cytometer QC and setup
⏺ Chart display area (left)
[Item Data]
Displays the names of QC parameters and the daily QC data for the date and time
selected by the cursor. When it is outside the limits, the item is highlighted in red.
[UL]
Displays the upper limit value based on the selected limit setting.
[Target]
For %rCV:
If [User Setting] or [Assay Value] is selected as the limit setting, the target value
from the baseline setup is displayed.
If [±2SD] or [±3SD] is selected, the target value is calculated as follows:
- When the number of data points is 1, the target will be the value of the data point.
(The result will be [Pass].)
- When the number of data points is 2, the target will be the value of the first data
point. (If the value of the second data point is within the range of the first value ± 1
minimum significant digit, the result will be [Pass].)
- When the number of data points is 3 or more, the target will be the mean value of
the previous data points after the last baseline setup or QC file setting.
For PMT:
The target value from the baseline setup is displayed. The [User Setting] is applied
for all channels as the limit setting.
[LL]
Displays the lower limit value based on the selected limit setting.
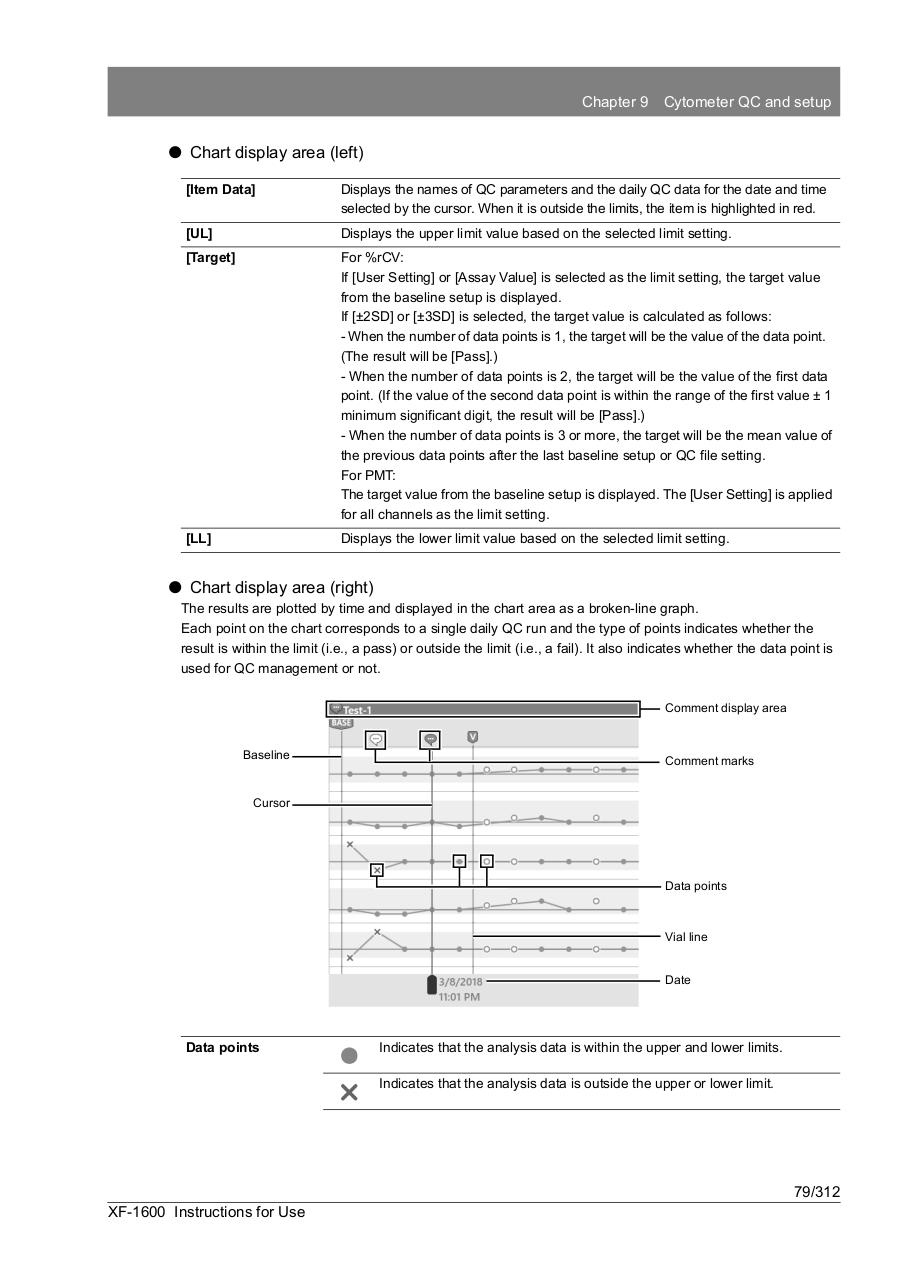
⏺ Chart display area (right)
The results are plotted by time and displayed in the chart area as a broken-line graph.
Each point on the chart corresponds to a single daily QC run and the type of points indicates whether the
result is within the limit (i.e., a pass) or outside the limit (i.e., a fail). It also indicates whether the data point is
used for QC management or not.
Comment display area
Baseline
Comment marks
Cursor
Data points
Vial line
Date
Data points
Indicates that the analysis data is within the upper and lower limits.
Indicates that the analysis data is outside the upper or lower limit.
79/312
XF-1600 Instructions for Use