XF 1600 IFU 5.0 en.pdf
Vista previa de texto
Chapter 9
Cytometer QC and setup
9.10.2 L-J charts
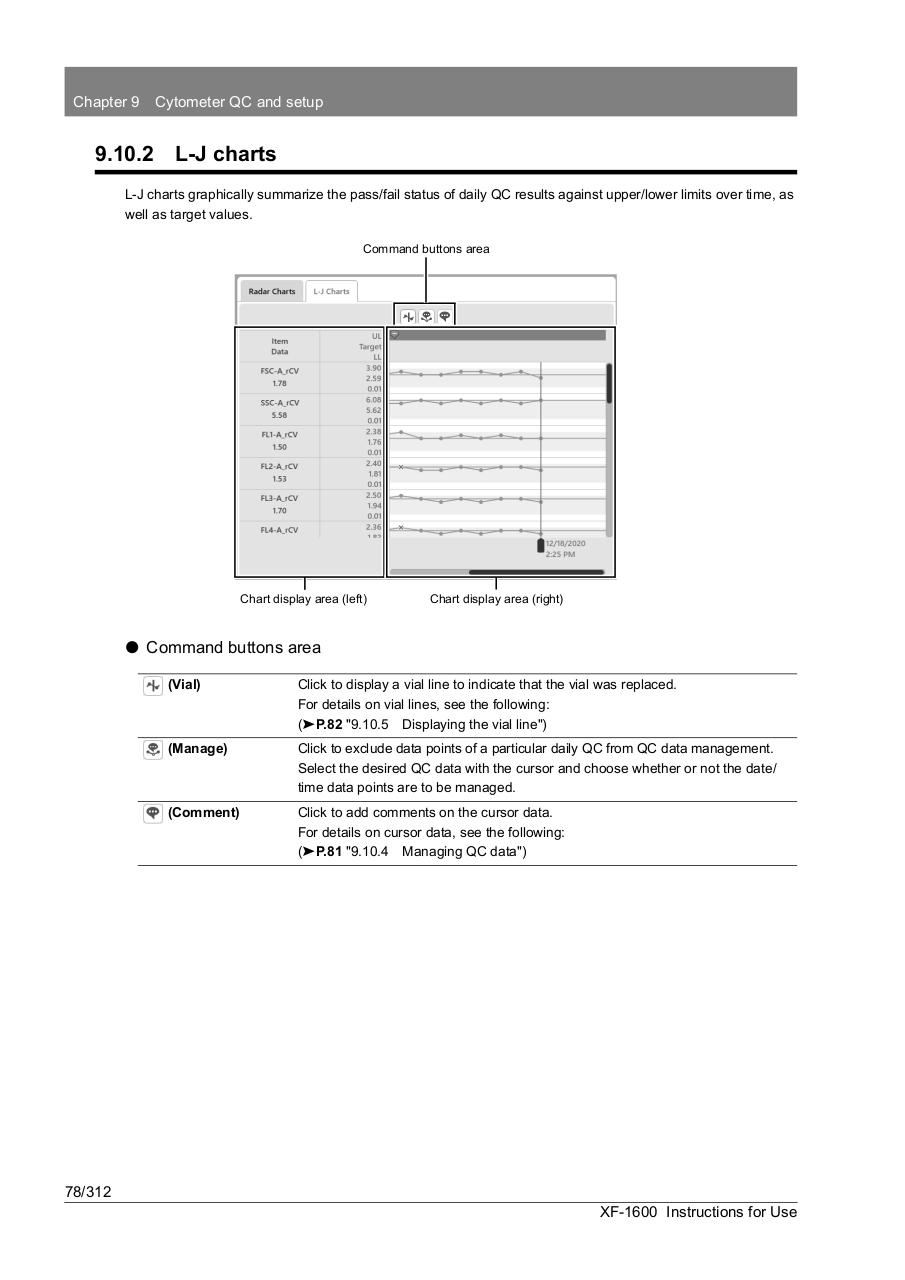
L-J charts graphically summarize the pass/fail status of daily QC results against upper/lower limits over time, as
well as target values.
Command buttons area
Chart display area (left)
Chart display area (right)
⏺ Command buttons area
(Vial)
Click to display a vial line to indicate that the vial was replaced.
For details on vial lines, see the following:
(➤P.82 "9.10.5 Displaying the vial line")
(Manage)
Click to exclude data points of a particular daily QC from QC data management.
Select the desired QC data with the cursor and choose whether or not the date/
time data points are to be managed.
(Comment)
Click to add comments on the cursor data.
For details on cursor data, see the following:
(➤P.81 "9.10.4 Managing QC data")
78/312
XF-1600 Instructions for Use