XF 1600 IFU 5.0 en.pdf
Vista previa de texto
Chapter 9
9.10
Cytometer QC and setup
Checking daily QC results
In the QC charts area, you can check the pass/fail status of daily QC results run against the baseline of a selected QC file.
9.10.1
Radar charts
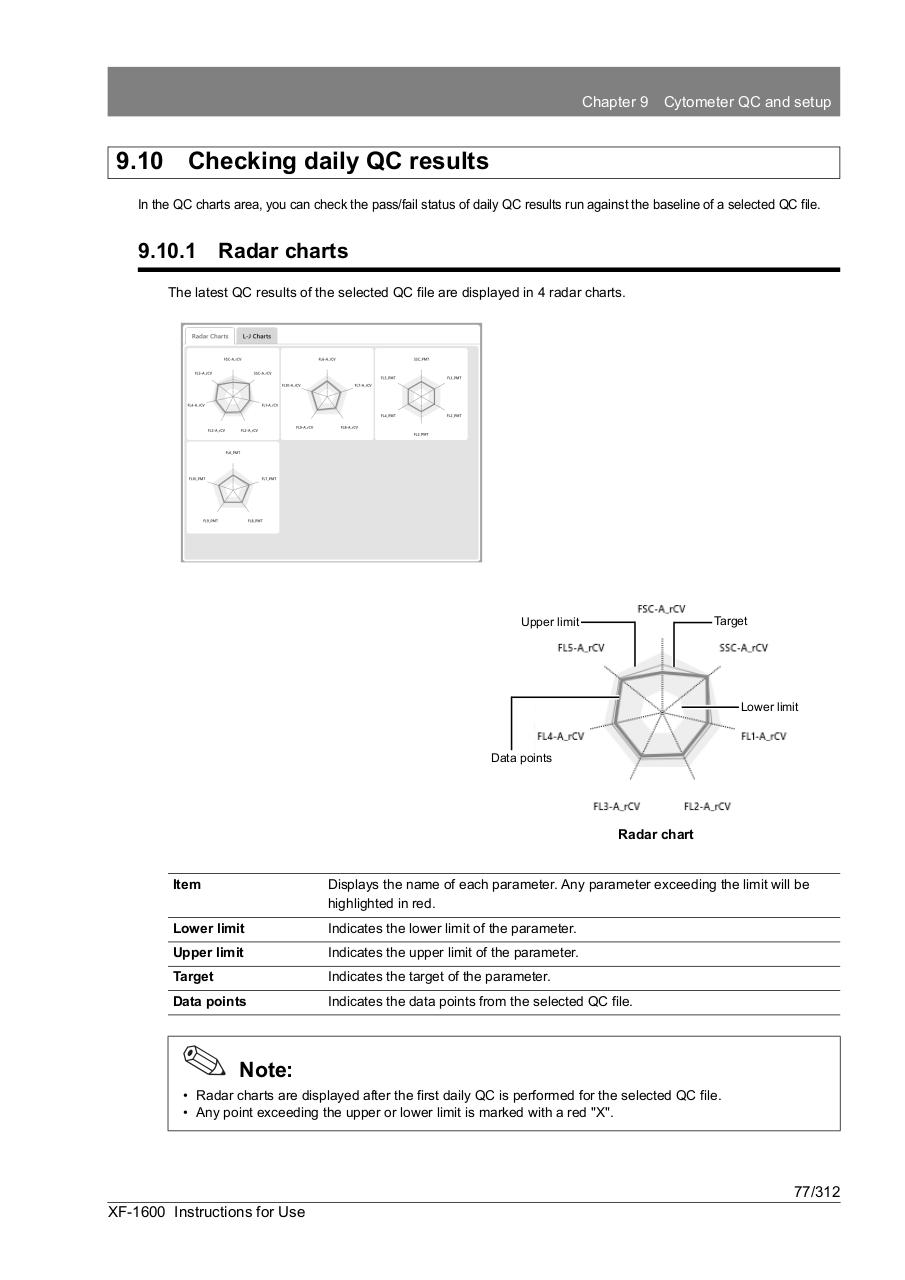
The latest QC results of the selected QC file are displayed in 4 radar charts.
Target
Upper limit
Lower limit
Data points
Radar chart
Item
Displays the name of each parameter. Any parameter exceeding the limit will be
highlighted in red.
Lower limit
Indicates the lower limit of the parameter.
Upper limit
Indicates the upper limit of the parameter.
Target
Indicates the target of the parameter.
Data points
Indicates the data points from the selected QC file.
Note:
• Radar charts are displayed after the first daily QC is performed for the selected QC file.
• Any point exceeding the upper or lower limit is marked with a red "X".
77/312
XF-1600 Instructions for Use