XF 1600 IFU 5.0 en.pdf
Vista previa de texto
Chapter 9
Cytometer QC and setup
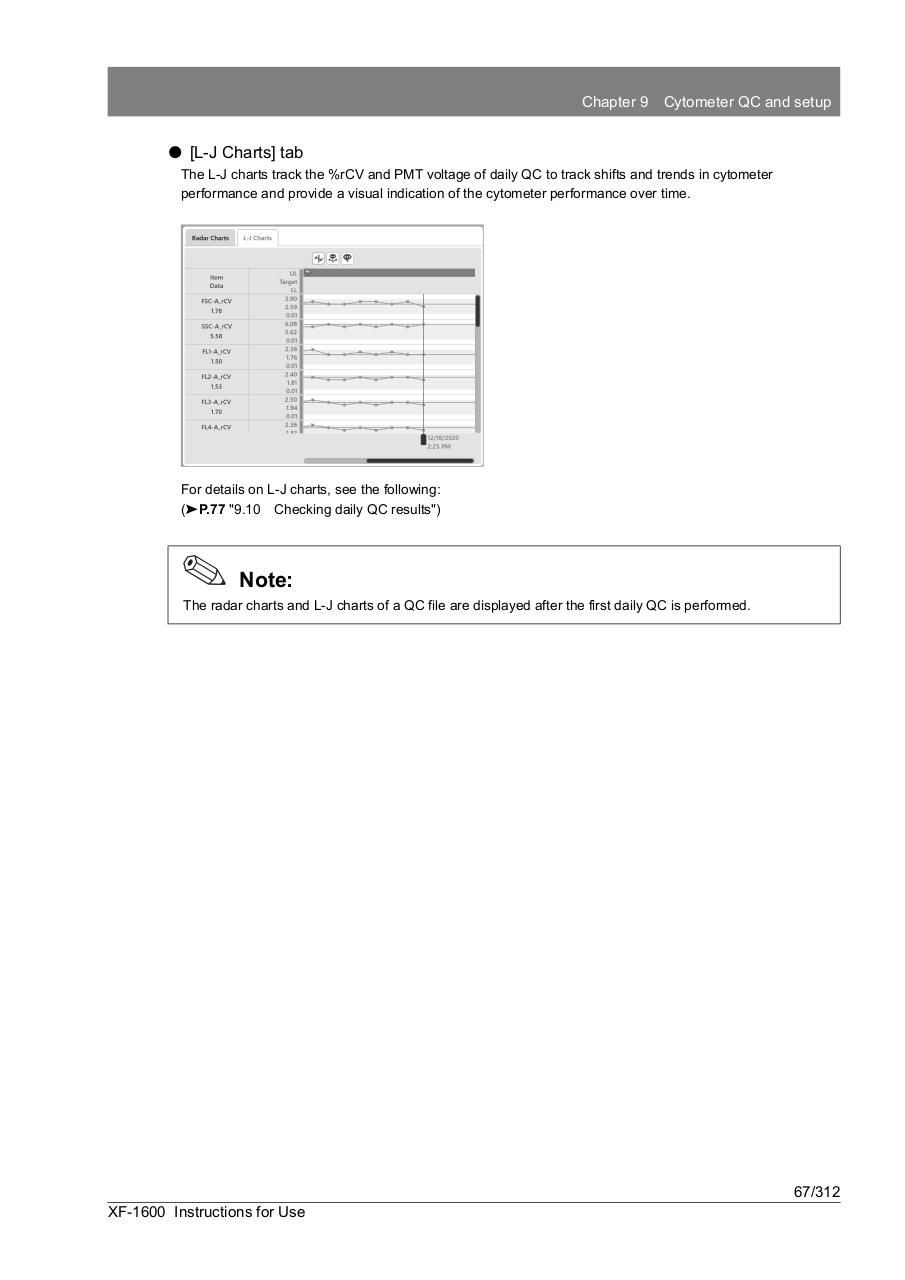
⏺ [L-J Charts] tab
The L-J charts track the %rCV and PMT voltage of daily QC to track shifts and trends in cytometer
performance and provide a visual indication of the cytometer performance over time.
For details on L-J charts, see the following:
(➤P.77 "9.10 Checking daily QC results")
Note:
The radar charts and L-J charts of a QC file are displayed after the first daily QC is performed.
67/312
XF-1600 Instructions for Use