XF 1600 IFU 5.0 en.pdf
Vista previa de texto
Chapter 9
Cytometer QC and setup
9.6.2 QC charts area
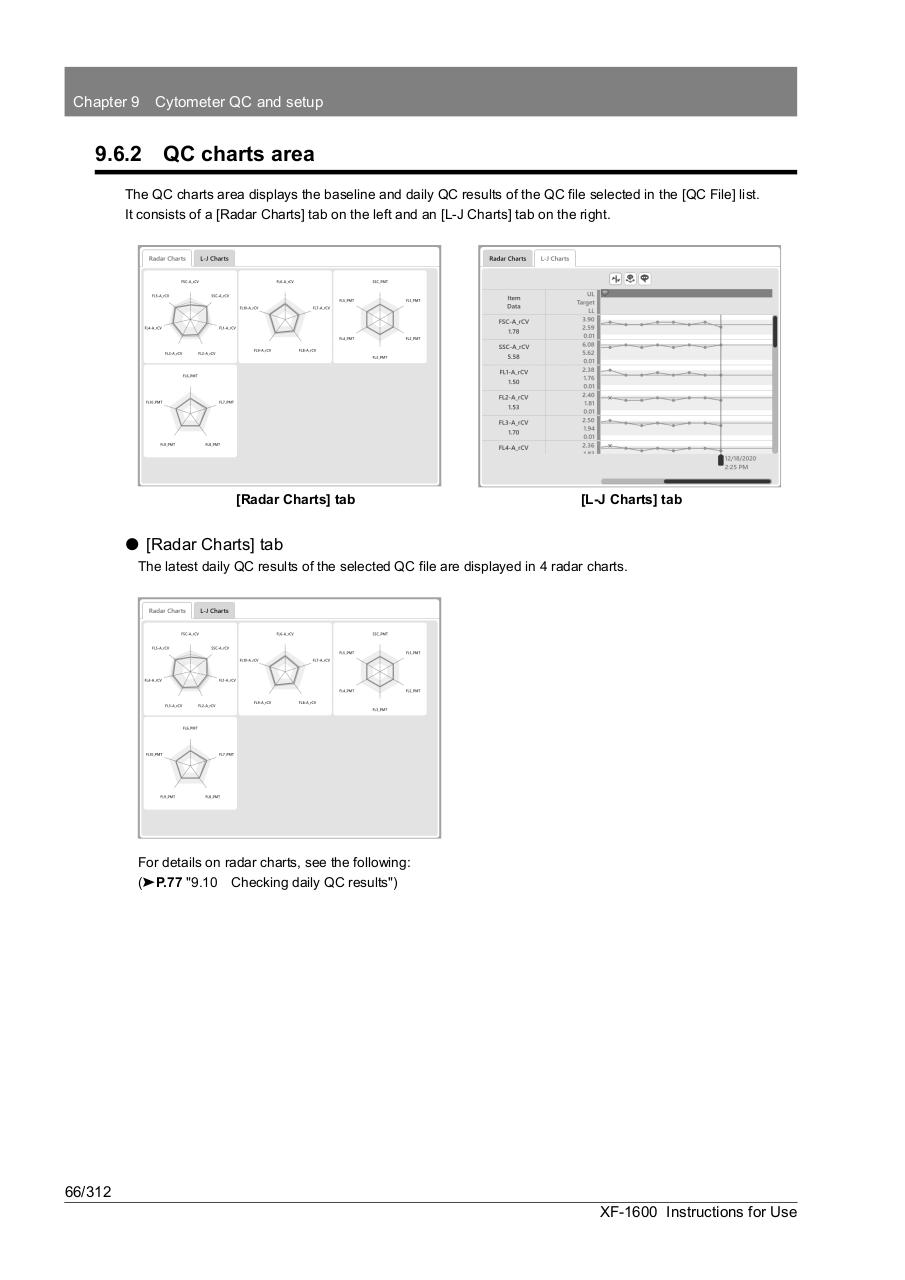
The QC charts area displays the baseline and daily QC results of the QC file selected in the [QC File] list.
It consists of a [Radar Charts] tab on the left and an [L-J Charts] tab on the right.
[Radar Charts] tab
[L-J Charts] tab
⏺ [Radar Charts] tab
The latest daily QC results of the selected QC file are displayed in 4 radar charts.
For details on radar charts, see the following:
(➤P.77 "9.10 Checking daily QC results")
66/312
XF-1600 Instructions for Use