Masterarbeit SS 1.2 Final.pdf
Vista previa de texto
FOOD STIMULI AND GENDER
49
correlation coefficient, which generally provides more reliable results for small sample sizes
(Elliott & Woodward, 2015).
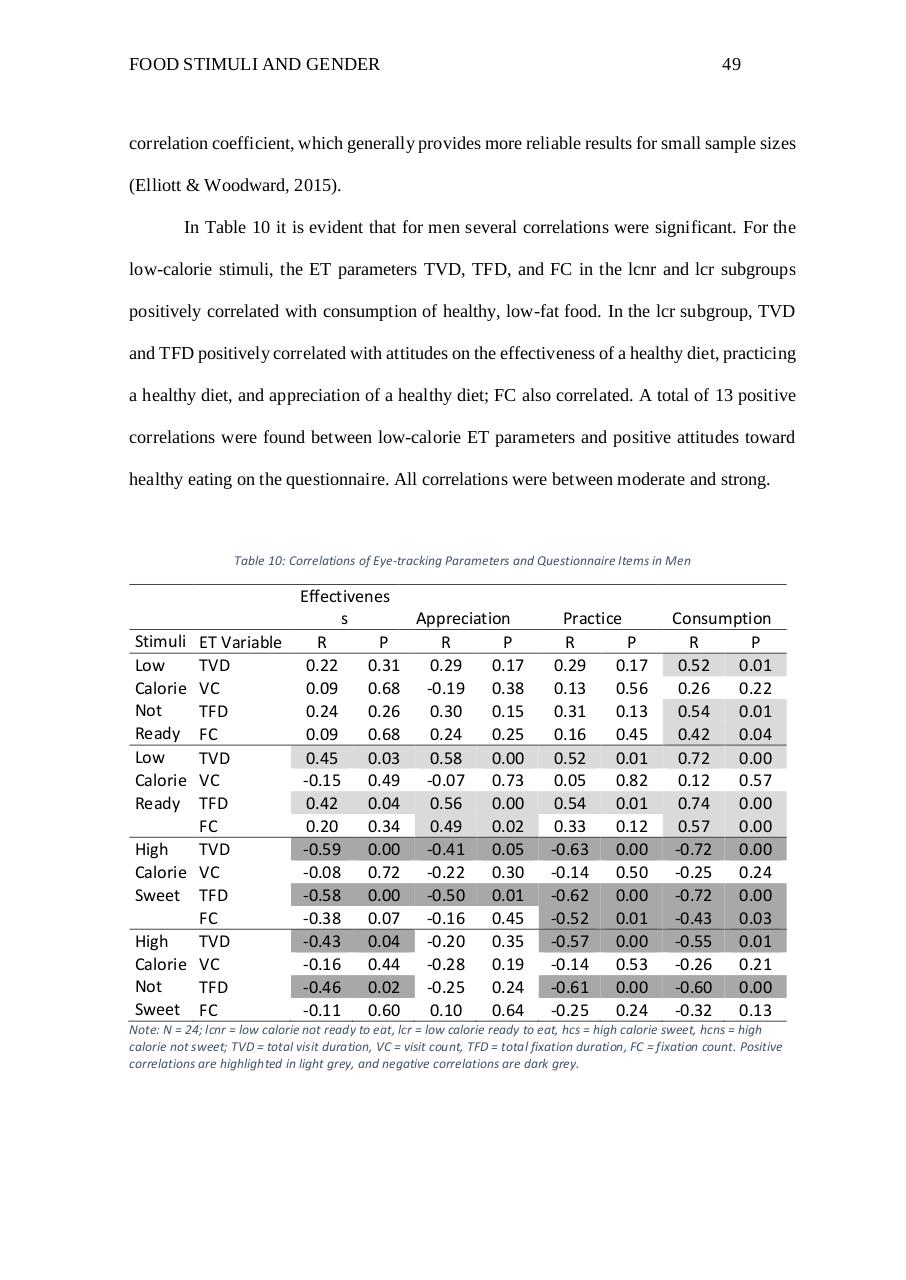
In Table 10 it is evident that for men several correlations were significant. For the
low-calorie stimuli, the ET parameters TVD, TFD, and FC in the lcnr and lcr subgroups
positively correlated with consumption of healthy, low-fat food. In the lcr subgroup, TVD
and TFD positively correlated with attitudes on the effectiveness of a healthy diet, practicing
a healthy diet, and appreciation of a healthy diet; FC also correlated. A total of 13 positive
correlations were found between low-calorie ET parameters and positive attitudes toward
healthy eating on the questionnaire. All correlations were between moderate and strong.
Table 10: Correlations of Eye-tracking Parameters and Questionnaire Items in Men
Effectivenes
s
Appreciation
Stimuli ET Variable
R
P
R
P
Low
TVD
0.22
0.31
0.29
0.17
Calorie VC
0.09
0.68 -0.19 0.38
Not
TFD
0.24
0.26
0.30
0.15
Ready FC
0.09
0.68
0.24
0.25
Low
TVD
0.45
0.03
0.58
0.00
Calorie VC
-0.15 0.49 -0.07 0.73
Ready TFD
0.42
0.04
0.56
0.00
FC
0.20
0.34
0.49
0.02
High
TVD
-0.59 0.00 -0.41 0.05
Calorie VC
-0.08 0.72 -0.22 0.30
Sweet TFD
-0.58 0.00 -0.50 0.01
FC
-0.38 0.07 -0.16 0.45
High
TVD
-0.43 0.04 -0.20 0.35
Calorie VC
-0.16 0.44 -0.28 0.19
Not
TFD
-0.46 0.02 -0.25 0.24
Sweet FC
-0.11 0.60
0.10
0.64
Practice
R
P
0.29
0.17
0.13
0.56
0.31
0.13
0.16
0.45
0.52
0.01
0.05
0.82
0.54
0.01
0.33
0.12
-0.63 0.00
-0.14 0.50
-0.62 0.00
-0.52 0.01
-0.57 0.00
-0.14 0.53
-0.61 0.00
-0.25 0.24
Consumption
R
P
0.52
0.01
0.26
0.22
0.54
0.01
0.42
0.04
0.72
0.00
0.12
0.57
0.74
0.00
0.57
0.00
-0.72 0.00
-0.25 0.24
-0.72 0.00
-0.43 0.03
-0.55 0.01
-0.26 0.21
-0.60 0.00
-0.32 0.13
Note: N = 24; lcnr = low calorie not ready to eat, lcr = low calorie ready to eat, hcs = high calorie sweet, hcns = high
calorie not sweet; TVD = total visit duration, VC = visit count, TFD = total fixation duration, FC = fixation count. Positive
correlations are highlighted in light grey, and negative correlations are dark grey.