Masterarbeit SS 1.2 Final.pdf
Vista previa de texto
FOOD STIMULI AND GENDER
47
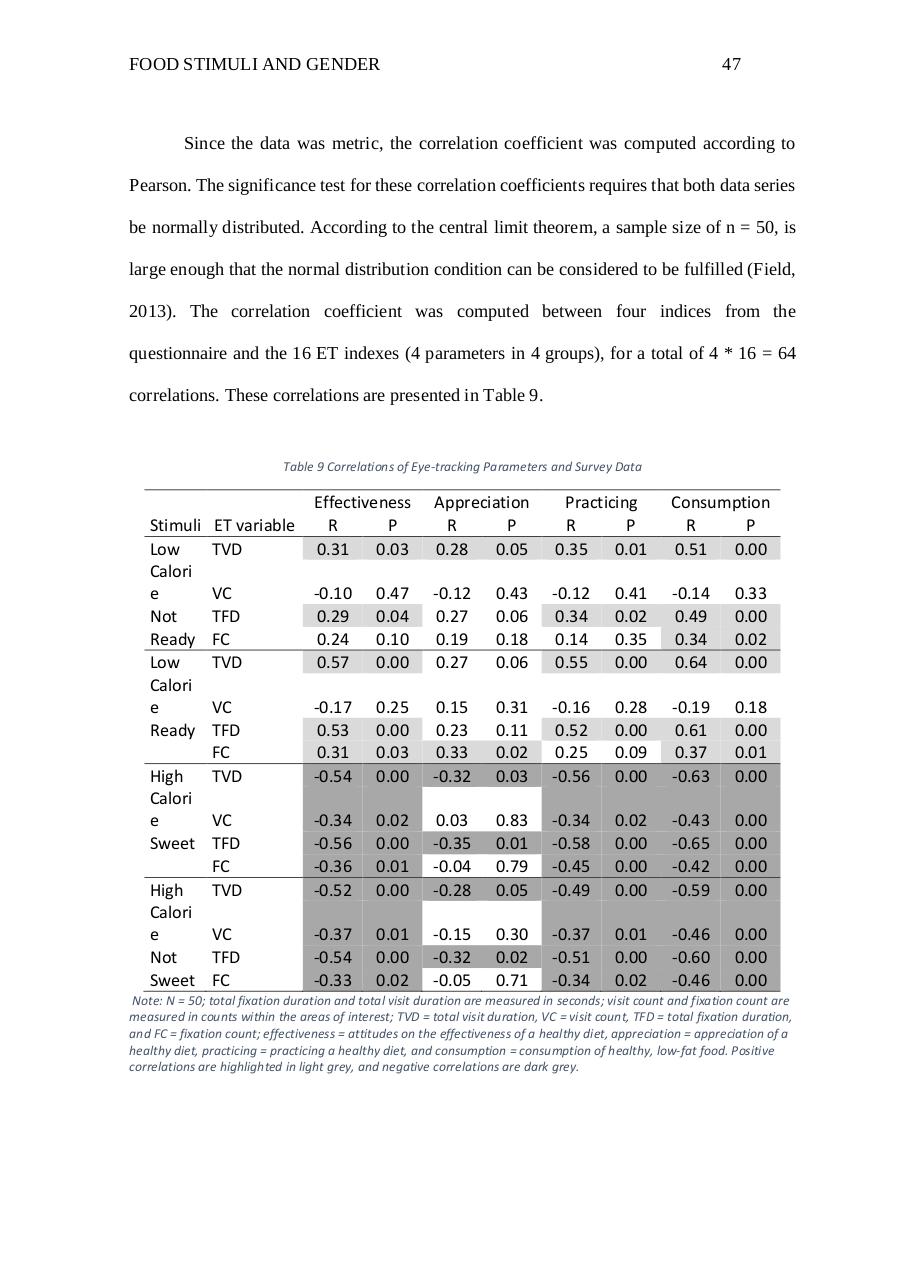
Since the data was metric, the correlation coefficient was computed according to
Pearson. The significance test for these correlation coefficients requires that both data series
be normally distributed. According to the central limit theorem, a sample size of n = 50, is
large enough that the normal distribution condition can be considered to be fulfilled (Field,
2013). The correlation coefficient was computed between four indices from the
questionnaire and the 16 ET indexes (4 parameters in 4 groups), for a total of 4 * 16 = 64
correlations. These correlations are presented in Table 9.
Table 9 Correlations of Eye-tracking Parameters and Survey Data
Stimuli
Low
Calori
e
Not
Ready
Low
Calori
e
Ready
ET variable
TVD
Effectiveness
R
P
0.31 0.03
Appreciation
R
P
0.28 0.05
Practicing
R
P
0.35 0.01
Consumption
R
P
0.51 0.00
VC
TFD
FC
TVD
-0.10
0.29
0.24
0.57
0.47
0.04
0.10
0.00
-0.12
0.27
0.19
0.27
0.43
0.06
0.18
0.06
-0.12
0.34
0.14
0.55
0.41
0.02
0.35
0.00
-0.14
0.49
0.34
0.64
0.33
0.00
0.02
0.00
VC
TFD
FC
TVD
-0.17
0.53
0.31
-0.54
0.25
0.00
0.03
0.00
0.15
0.23
0.33
-0.32
0.31
0.11
0.02
0.03
-0.16
0.52
0.25
-0.56
0.28
0.00
0.09
0.00
-0.19
0.61
0.37
-0.63
0.18
0.00
0.01
0.00
-0.34
-0.56
-0.36
-0.52
0.02
0.00
0.01
0.00
0.03
-0.35
-0.04
-0.28
0.83
0.01
0.79
0.05
-0.34
-0.58
-0.45
-0.49
0.02
0.00
0.00
0.00
-0.43
-0.65
-0.42
-0.59
0.00
0.00
0.00
0.00
-0.37
-0.54
-0.33
0.01
0.00
0.02
-0.15
-0.32
-0.05
0.30
0.02
0.71
-0.37
-0.51
-0.34
0.01
0.00
0.02
-0.46
-0.60
-0.46
0.00
0.00
0.00
High
Calori
e
VC
Sweet TFD
FC
High
TVD
Calori
e
VC
Not
TFD
Sweet FC
Note: N = 50; total fixation duration and total visit duration are measured in seconds; visit count and fixation count are
measured in counts within the areas of interest; TVD = total visit duration, VC = visit count, TFD = total fixation duration,
and FC = fixation count; effectiveness = attitudes on the effectiveness of a healthy diet, appreciation = appreciation of a
healthy diet, practicing = practicing a healthy diet, and consumption = consumption of healthy, low-fat food. Positive
correlations are highlighted in light grey, and negative correlations are dark grey.