Masterarbeit SS 1.2 Final.pdf
Vista previa de texto
FOOD STIMULI AND GENDER
46
4.3 Questionnaires
First, a correlation between attitudes toward healthy eating and the ET variable was
made in general and divided by gender. An analysis of the Dutch Eating Behavior
Questionnaire separated by gender was performed to examine possible motivational
variables that could account for gender differences. A correlation between food preferences
and frequency of consumption was also computed with the eye-tracking data. Before the
analysis, a reliability test of the questionnaires was performed. Generally, a scale is
considered reliable if the Cronbach's α is greater than 0.7 (Breakwell, Hammond, & FifeSchaw, 2006).
4.3.1Analysis of Attitudes Toward Healthy Eating Questionnaire
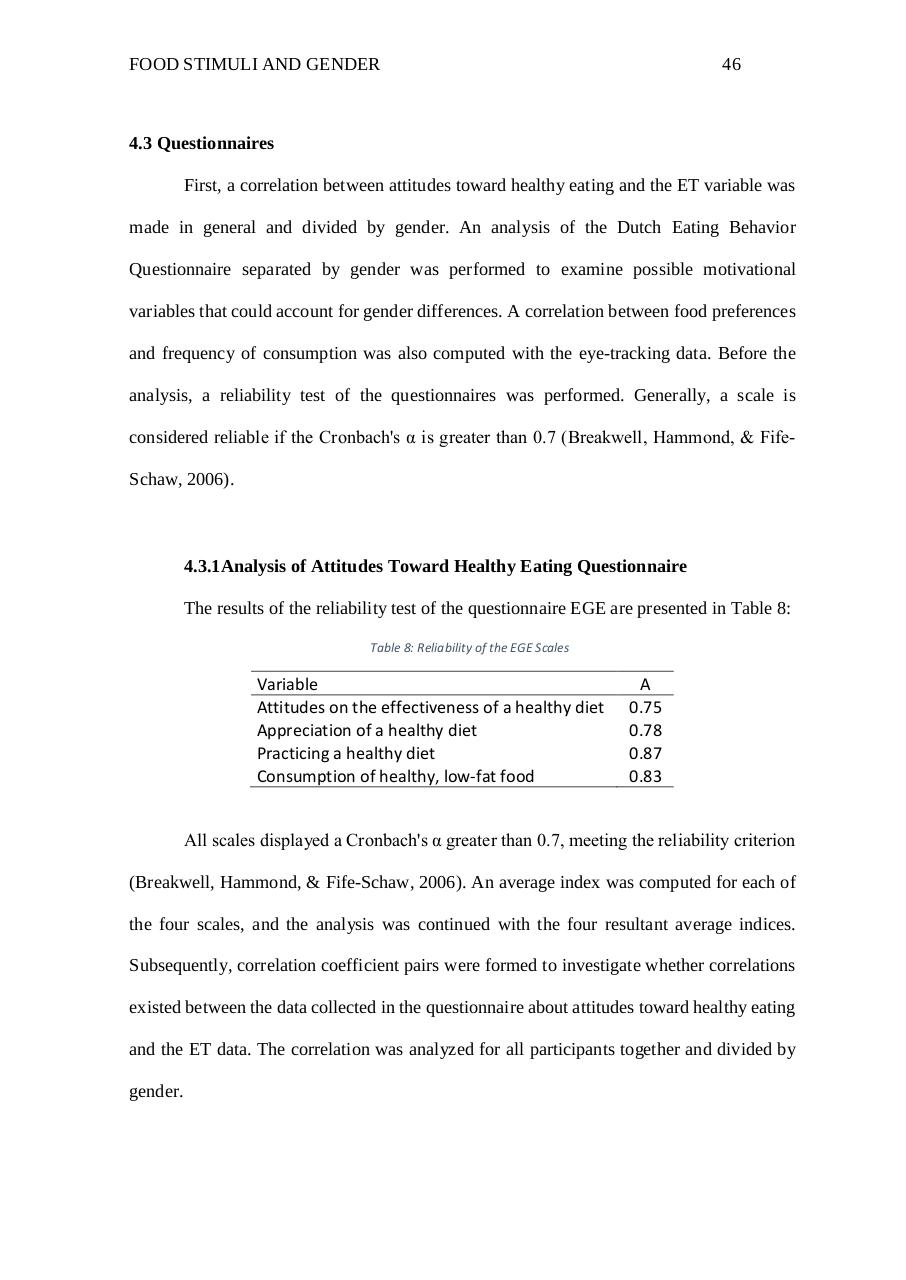
The results of the reliability test of the questionnaire EGE are presented in Table 8:
Table 8: Reliability of the EGE Scales
Variable
Attitudes on the effectiveness of a healthy diet
Appreciation of a healthy diet
Practicing a healthy diet
Consumption of healthy, low-fat food
Α
0.75
0.78
0.87
0.83
All scales displayed a Cronbach's α greater than 0.7, meeting the reliability criterion
(Breakwell, Hammond, & Fife-Schaw, 2006). An average index was computed for each of
the four scales, and the analysis was continued with the four resultant average indices.
Subsequently, correlation coefficient pairs were formed to investigate whether correlations
existed between the data collected in the questionnaire about attitudes toward healthy eating
and the ET data. The correlation was analyzed for all participants together and divided by
gender.