Masterarbeit SS 1.2 Final.pdf
Vista previa de texto
FOOD STIMULI AND GENDER
44
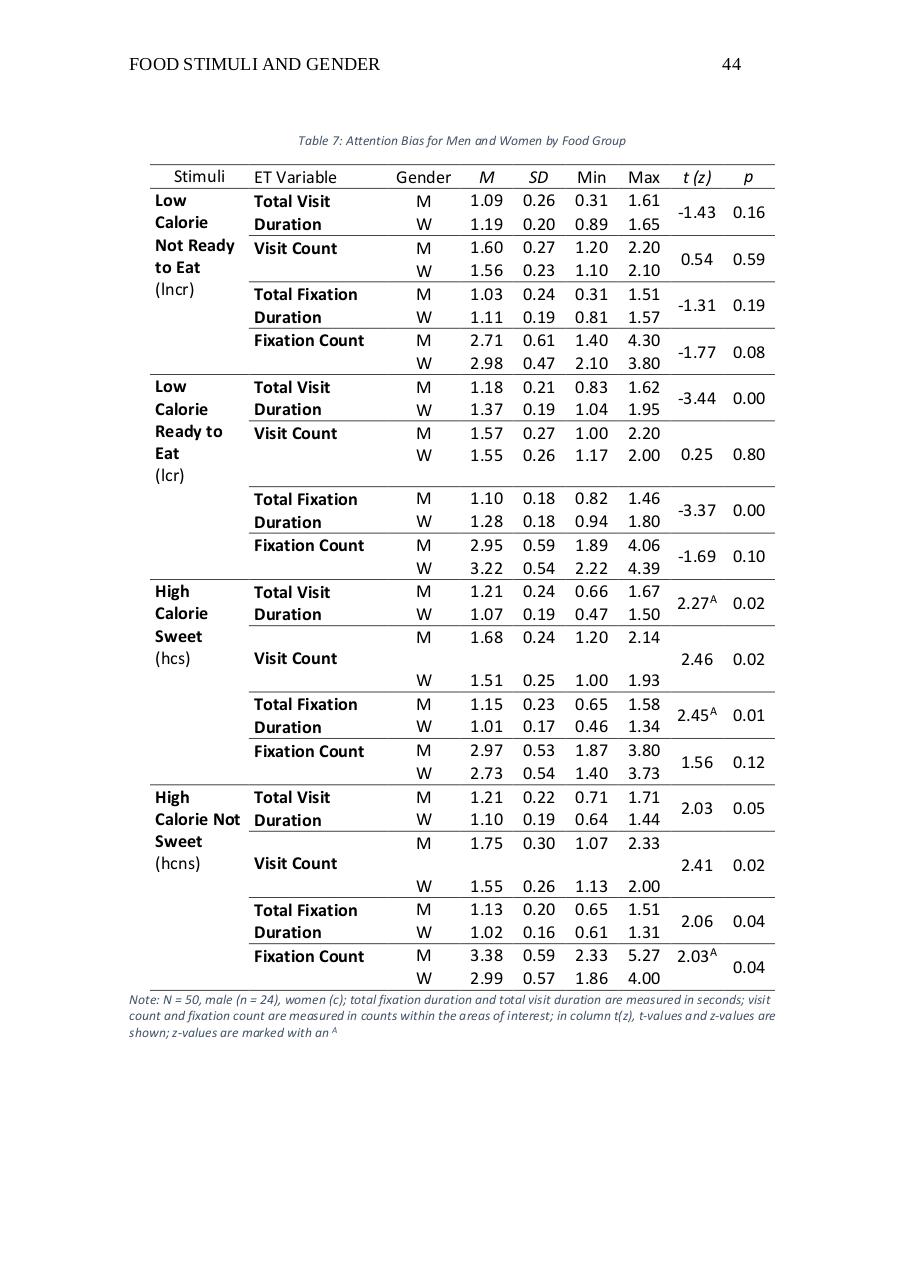
Table 7: Attention Bias for Men and Women by Food Group
Stimuli
Low
Calorie
Not Ready
to Eat
(lncr)
ET Variable
Total Visit
Duration
Visit Count
Total Fixation
Duration
Fixation Count
Low
Calorie
Ready to
Eat
(lcr)
Total Visit
Duration
Visit Count
High
Calorie
Sweet
(hcs)
Total Visit
Duration
Total Fixation
Duration
Fixation Count
Visit Count
Total Fixation
Duration
Fixation Count
High
Total Visit
Calorie Not Duration
Sweet
(hcns)
Visit Count
Total Fixation
Duration
Fixation Count
t (z)
p
Gender
M
W
M
W
M
W
M
W
M
W
M
W
M
1.09
1.19
1.60
1.56
1.03
1.11
2.71
2.98
1.18
1.37
1.57
1.55
SD
0.26
0.20
0.27
0.23
0.24
0.19
0.61
0.47
0.21
0.19
0.27
0.26
Min
0.31
0.89
1.20
1.10
0.31
0.81
1.40
2.10
0.83
1.04
1.00
1.17
Max
1.61
1.65
2.20
2.10
1.51
1.57
4.30
3.80
1.62
1.95
2.20
2.00
M
W
M
W
M
W
M
1.10
1.28
2.95
3.22
1.21
1.07
1.68
0.18
0.18
0.59
0.54
0.24
0.19
0.24
0.82
0.94
1.89
2.22
0.66
0.47
1.20
W
M
W
M
W
M
W
M
1.51
1.15
1.01
2.97
2.73
1.21
1.10
1.75
0.25
0.23
0.17
0.53
0.54
0.22
0.19
0.30
1.00
0.65
0.46
1.87
1.40
0.71
0.64
1.07
W
M
W
M
W
1.55
1.13
1.02
3.38
2.99
0.26
0.20
0.16
0.59
0.57
1.13
0.65
0.61
2.33
1.86
1.46
-3.37 0.00
1.80
4.06
-1.69 0.10
4.39
1.67
2.27A 0.02
1.50
2.14
2.46 0.02
1.93
1.58
2.45A 0.01
1.34
3.80
1.56 0.12
3.73
1.71
2.03 0.05
1.44
2.33
2.41 0.02
2.00
1.51
2.06 0.04
1.31
5.27 2.03A
0.04
4.00
-1.43 0.16
0.54
0.59
-1.31 0.19
-1.77 0.08
-3.44 0.00
0.25
0.80
Note: N = 50, male (n = 24), women (c); total fixation duration and total visit duration are measured in seconds; visit
count and fixation count are measured in counts within the areas of interest; in column t(z), t-values and z-values are
shown; z-values are marked with an A