anexo4 OtmarGeiss.pdf
Vista previa de texto
Special Issue on COVID-19 Aerosol Drivers, Impacts and Mitigation (X)
ORIGINAL RESEARCH
https://doi.org/10.4209/aaqr.2020.07.0403
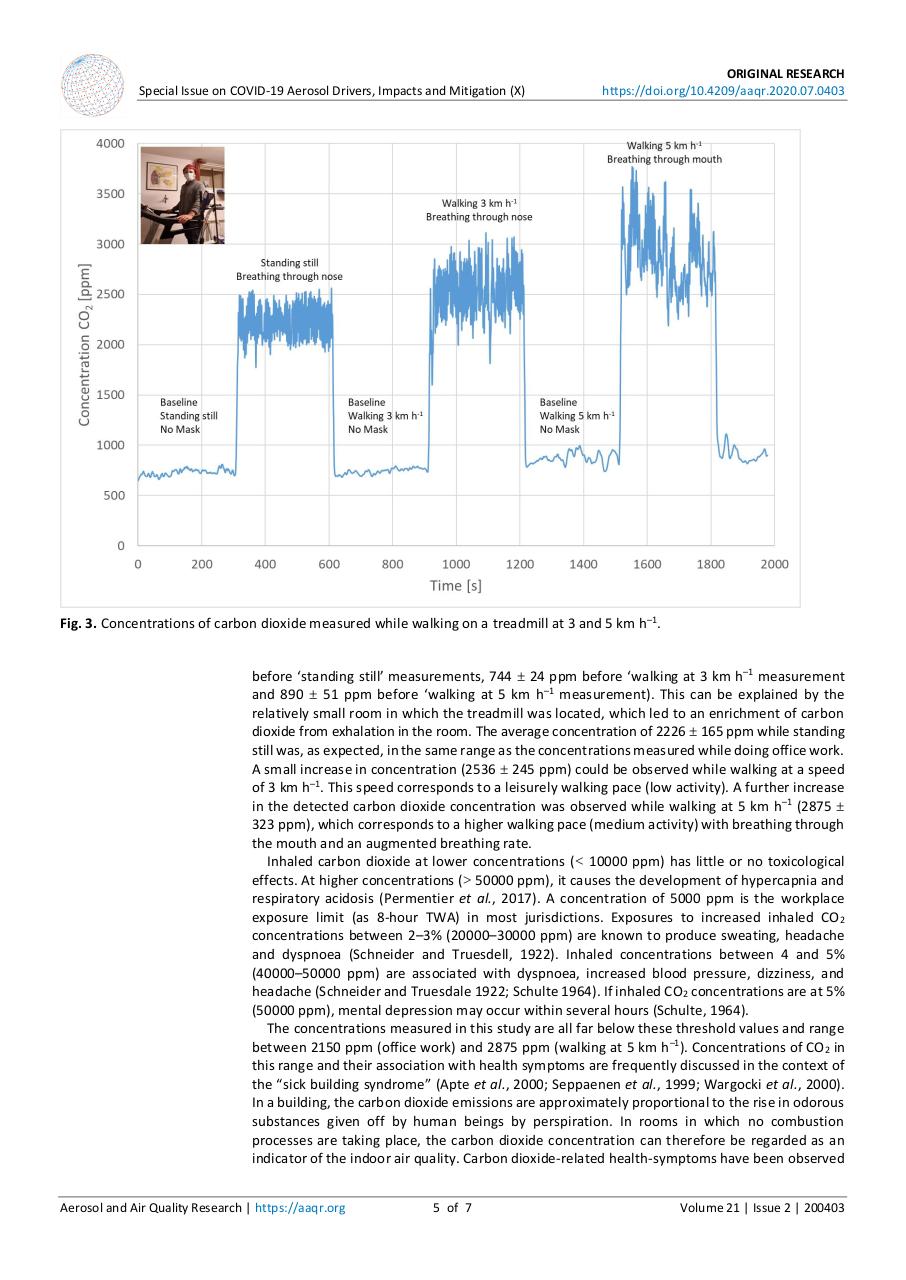
Fig. 3. Concentrations of carbon dioxide measured while walking on a treadmill at 3 and 5 km h–1.
before ‘standing still’ measurements, 744 ± 24 ppm before ‘walking at 3 km h–1 measurement
and 890 ± 51 ppm before ‘walking at 5 km h–1 measurement). This can be explained by the
relatively small room in which the treadmill was located, which led to an enrichment of carbon
dioxide from exhalation in the room. The average concentration of 2226 ± 165 ppm while standing
still was, as expected, in the same range as the concentrations measured while doing office work.
A small increase in concentration (2536 ± 245 ppm) could be observed while walking at a speed
of 3 km h–1. This speed corresponds to a leisurely walking pace (low activity). A further increase
in the detected carbon dioxide concentration was observed while walking at 5 km h –1 (2875 ±
323 ppm), which corresponds to a higher walking pace (medium activity) with breathing through
the mouth and an augmented breathing rate.
Inhaled carbon dioxide at lower concentrations (< 10000 ppm) has little or no toxicological
effects. At higher concentrations (> 50000 ppm), it causes the development of hypercapnia and
respiratory acidosis (Permentier et al., 2017). A concentration of 5000 ppm is the workplace
exposure limit (as 8-hour TWA) in most jurisdictions. Exposures to increased inhaled CO 2
concentrations between 2–3% (20000–30000 ppm) are known to produce sweating, headache
and dyspnoea (Schneider and Truesdell, 1922). Inhaled concentrations between 4 and 5%
(40000–50000 ppm) are associated with dyspnoea, increased blood pressure, dizziness, and
headache (Schneider and Truesdale 1922; Schulte 1964). If inhaled CO2 concentrations are at 5%
(50000 ppm), mental depression may occur within several hours (Schulte, 1964).
The concentrations measured in this study are all far below these threshold values and range
between 2150 ppm (office work) and 2875 ppm (walking at 5 km h–1). Concentrations of CO2 in
this range and their association with health symptoms are frequently discussed in the context of
the “sick building syndrome” (Apte et al., 2000; Seppaenen et al., 1999; Wargocki et al., 2000).
In a building, the carbon dioxide emissions are approximately proportional to the rise in odorous
substances given off by human beings by perspiration. In rooms in which no combustion
processes are taking place, the carbon dioxide concentration can therefore be regarded as an
indicator of the indoor air quality. Carbon dioxide-related health-symptoms have been observed
Aerosol and Air Quality Research | https://aaqr.org
5 of 7
Volume 21 | Issue 2 | 200403