anexo4 OtmarGeiss.pdf
Vista previa de texto
Special Issue on COVID-19 Aerosol Drivers, Impacts and Mitigation (X)
ORIGINAL RESEARCH
https://doi.org/10.4209/aaqr.2020.07.0403
The concentration of carbon dioxide was measured for two activity patterns: in the first
scenario the male, 50 year old volunteer was working on a computer, breathing through the nose
and remaining seated for the duration of the measurements. Under these conditions, all three
types of face masks were tested. In the second scenario, the volunteer was walking on a treadmill
at 0, 3 and 5 km h–1. While at 0 and 3 km h–1, the volunteer was breathing through his nose, at
5 km h–1 he was breathing through his mouth. Each new condition was preceded by the
registration of a baseline (the same condition but without the masks being worn). The sampling
duration for each activity pattern was 5 minutes. The data collection frequency (sampling rate)
was set at 1 s–1.
3 RESULTS AND DISCUSSION
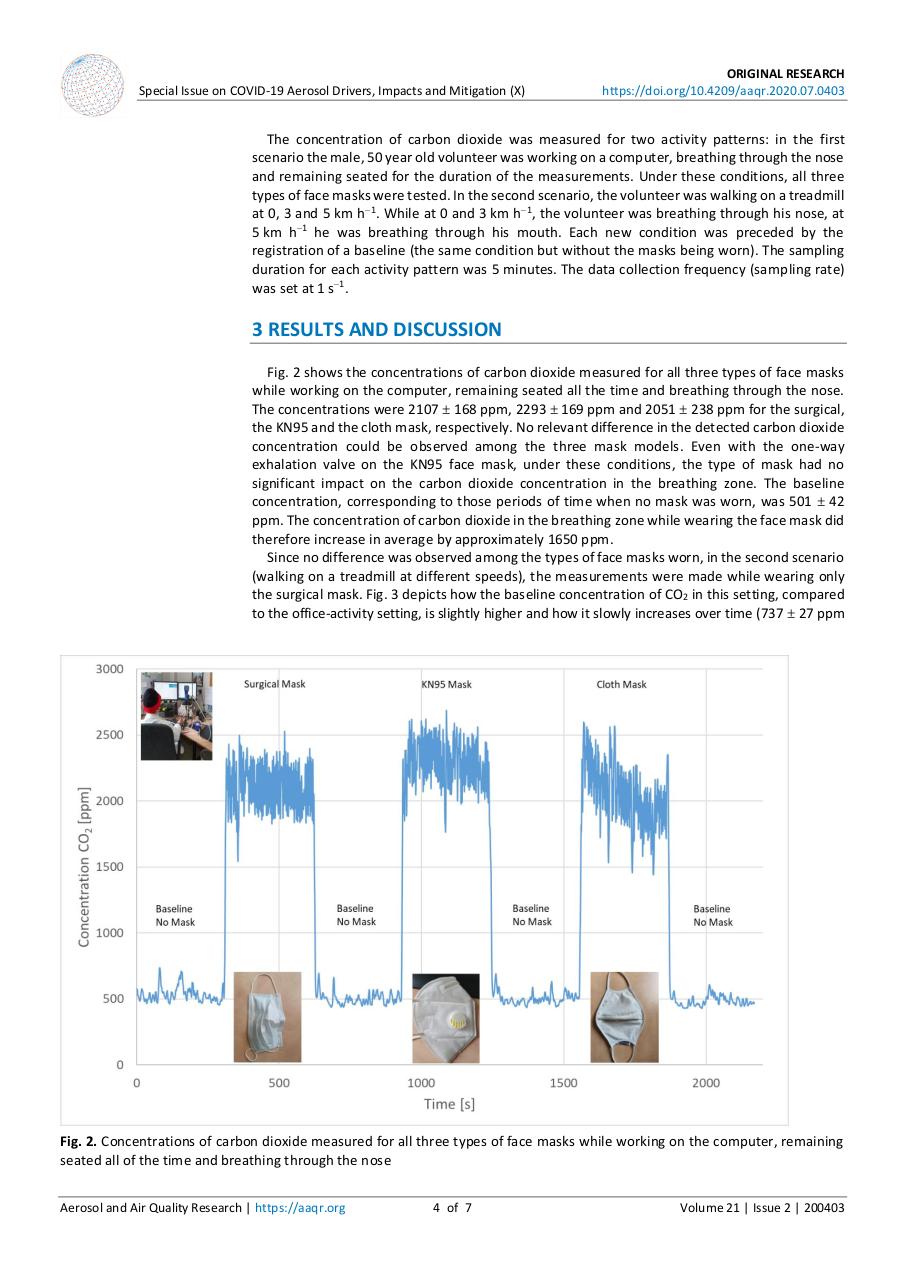
Fig. 2 shows the concentrations of carbon dioxide measured for all three types of face masks
while working on the computer, remaining seated all the time and breathing through the nose.
The concentrations were 2107 ± 168 ppm, 2293 ± 169 ppm and 2051 ± 238 ppm for the surgical,
the KN95 and the cloth mask, respectively. No relevant difference in the detected carbon dioxide
concentration could be observed among the three mask models. Even with the one-way
exhalation valve on the KN95 face mask, under these conditions, the type of mask had no
significant impact on the carbon dioxide concentration in the breathing zone. The baseline
concentration, corresponding to those periods of time when no mask was worn, was 501 ± 42
ppm. The concentration of carbon dioxide in the breathing zone while wearing the face mask did
therefore increase in average by approximately 1650 ppm.
Since no difference was observed among the types of face masks worn, in the second scenario
(walking on a treadmill at different speeds), the measurements were made while wearing only
the surgical mask. Fig. 3 depicts how the baseline concentration of CO2 in this setting, compared
to the office-activity setting, is slightly higher and how it slowly increases over time (737 ± 27 ppm
Fig. 2. Concentrations of carbon dioxide measured for all three types of face masks while working on the computer, remaining
seated all of the time and breathing through the nose
Aerosol and Air Quality Research | https://aaqr.org
4 of 7
Volume 21 | Issue 2 | 200403