Masterarbeit SS 1.2 Final.pdf
Vista previa de texto
FOOD STIMULI AND GENDER
55
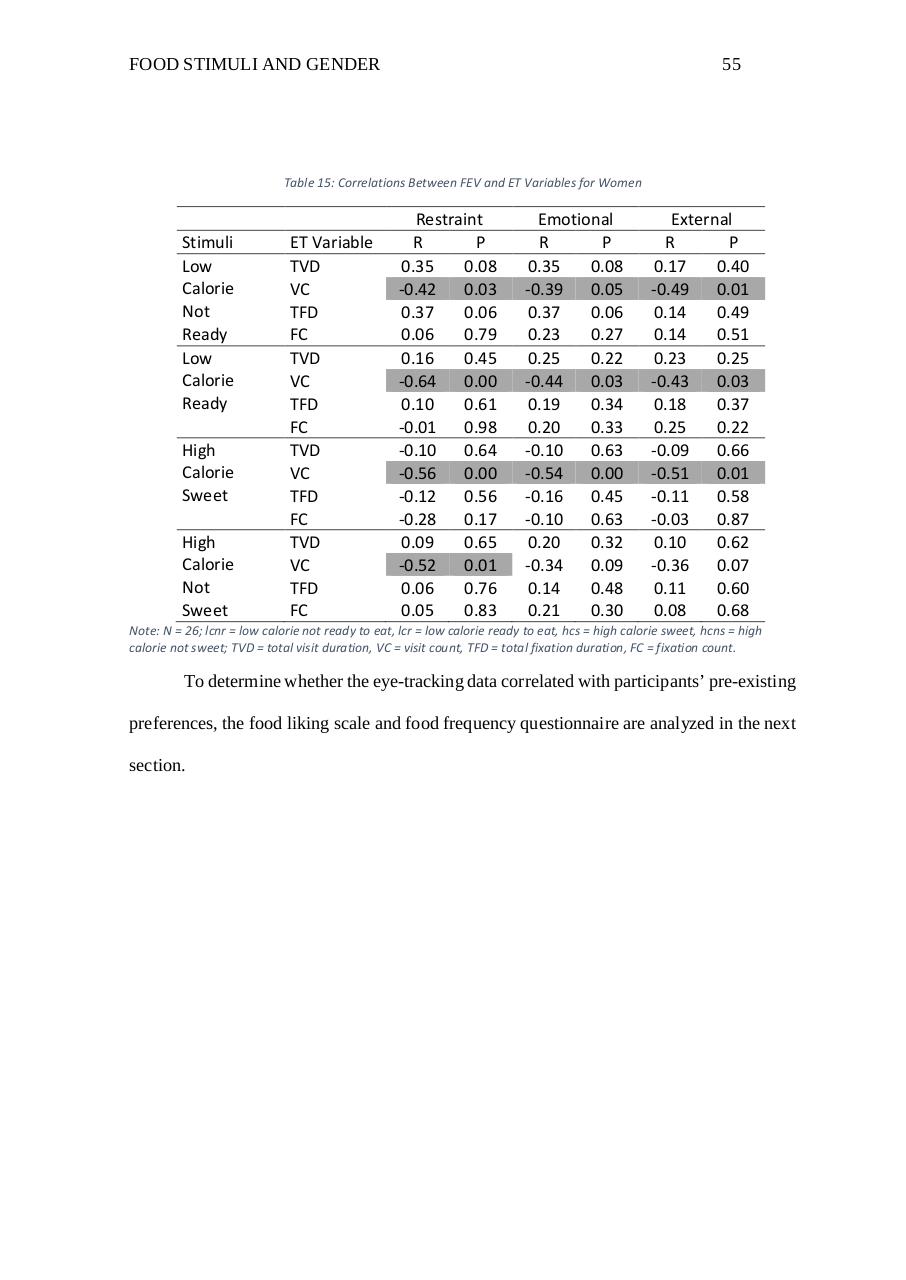
Table 15: Correlations Between FEV and ET Variables for Women
Stimuli
Low
Calorie
Not
Ready
Low
Calorie
Ready
High
Calorie
Sweet
High
Calorie
Not
Sweet
ET Variable
TVD
VC
TFD
FC
TVD
VC
TFD
FC
TVD
VC
TFD
FC
TVD
VC
TFD
FC
Restraint
R
P
0.35
0.08
-0.42
0.03
0.37
0.06
0.06
0.79
0.16
0.45
-0.64
0.00
0.10
0.61
-0.01
0.98
-0.10
0.64
-0.56
0.00
-0.12
0.56
-0.28
0.17
0.09
0.65
-0.52
0.01
0.06
0.76
0.05
0.83
Emotional
R
P
0.35
0.08
-0.39
0.05
0.37
0.06
0.23
0.27
0.25
0.22
-0.44
0.03
0.19
0.34
0.20
0.33
-0.10
0.63
-0.54
0.00
-0.16
0.45
-0.10
0.63
0.20
0.32
-0.34
0.09
0.14
0.48
0.21
0.30
External
R
P
0.17
0.40
-0.49
0.01
0.14
0.49
0.14
0.51
0.23
0.25
-0.43
0.03
0.18
0.37
0.25
0.22
-0.09
0.66
-0.51
0.01
-0.11
0.58
-0.03
0.87
0.10
0.62
-0.36
0.07
0.11
0.60
0.08
0.68
Note: N = 26; lcnr = low calorie not ready to eat, lcr = low calorie ready to eat, hcs = high calorie sweet, hcns = high
calorie not sweet; TVD = total visit duration, VC = visit count, TFD = total fixation duration, FC = fixation count.
To determine whether the eye-tracking data correlated with participants’ pre-existing
preferences, the food liking scale and food frequency questionnaire are analyzed in the next
section.