Masterarbeit SS 1.2 Final.pdf
Vista previa de texto
FOOD STIMULI AND GENDER
56
4.3.3 Correlations Between the FLS, the FFQ, and ET Data
Correlations matching the food stimuli with the questionnaires were important to
avoid a gaze bias resulting from preference formation rather than pre-existing preference
(Schotter, Berry, McKenzie, & Rayner, 2010). Top-down effects, also called goal-oriented
attention, can be influenced by either pre-existing preferences or preference formation when
receiving task instructions (van der Laan et al., 2015). Since no instructions were given to
participants in this study, it can be assumed that the gaze bias is due to pre-existing
preferences rather than preference formation.
The data from the FLS and the FFQ questionnaires was collected not for each
specific food stimuli but in food categories in order to avoid influencing and extenuating
participants. For this reason, a match of each single food or analysis as in the previous
questionnaires with food groups was not possible. The FLS and FFQ data were divided into
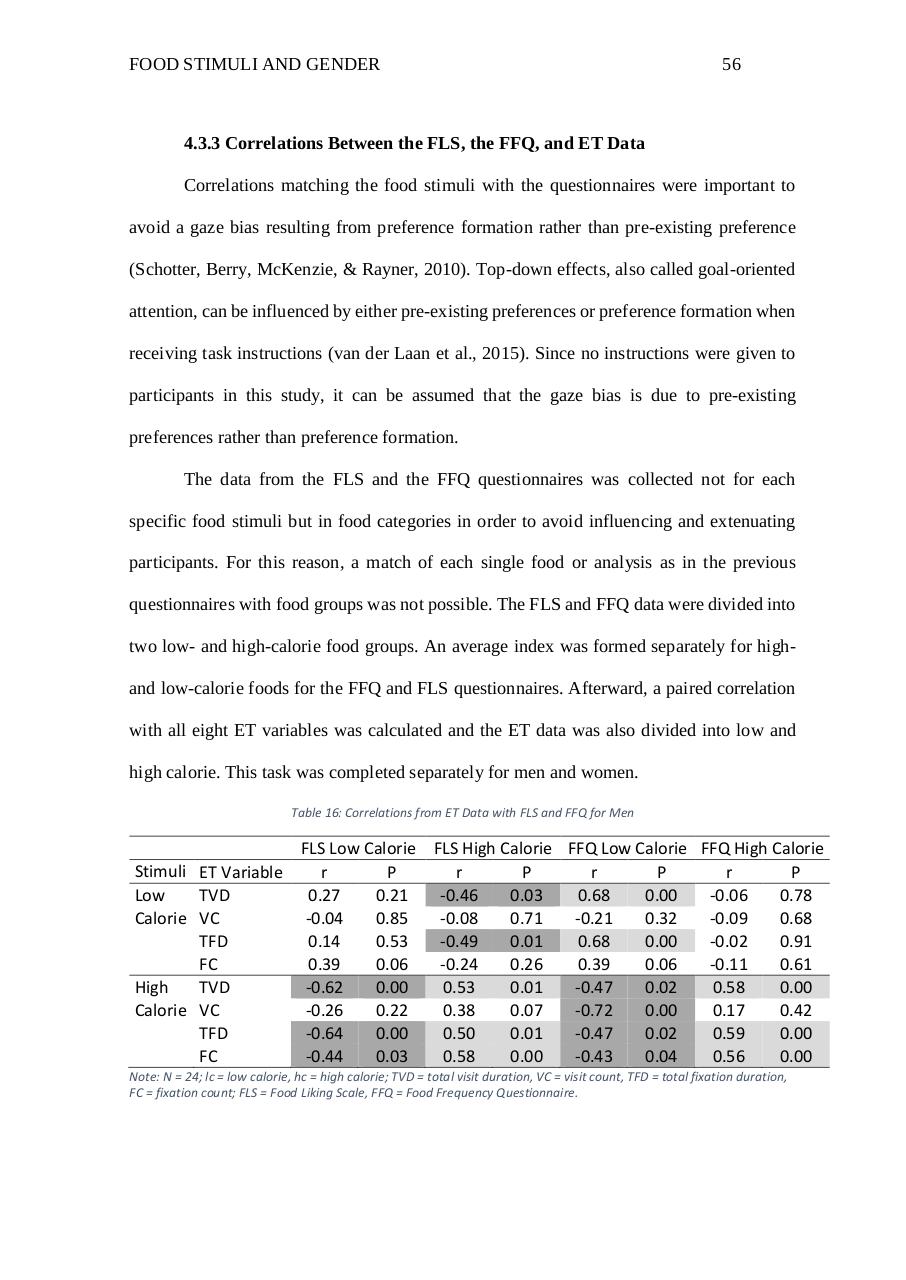
two low- and high-calorie food groups. An average index was formed separately for highand low-calorie foods for the FFQ and FLS questionnaires. Afterward, a paired correlation
with all eight ET variables was calculated and the ET data was also divided into low and
high calorie. This task was completed separately for men and women.
Table 16: Correlations from ET Data with FLS and FFQ for Men
FLS Low Calorie FLS High Calorie FFQ Low Calorie FFQ High Calorie
Stimuli ET Variable
r
P
r
P
r
P
r
P
Low
TVD
0.27
0.21
-0.46
0.03
0.68
0.00
-0.06
0.78
Calorie VC
-0.04
0.85
-0.08
0.71
-0.21
0.32
-0.09
0.68
TFD
0.14
0.53
-0.49
0.01
0.68
0.00
-0.02
0.91
FC
0.39
0.06
-0.24
0.26
0.39
0.06
-0.11
0.61
High
TVD
-0.62
0.00
0.53
0.01
-0.47
0.02
0.58
0.00
Calorie VC
-0.26
0.22
0.38
0.07
-0.72
0.00
0.17
0.42
TFD
-0.64
0.00
0.50
0.01
-0.47
0.02
0.59
0.00
FC
-0.44
0.03
0.58
0.00
-0.43
0.04
0.56
0.00
Note: N = 24; lc = low calorie, hc = high calorie; TVD = total visit duration, VC = visit count, TFD = total fixation duration,
FC = fixation count; FLS = Food Liking Scale, FFQ = Food Frequency Questionnaire.