Masterarbeit SS 1.2 Final.pdf
Vista previa de texto
FOOD STIMULI AND GENDER
54
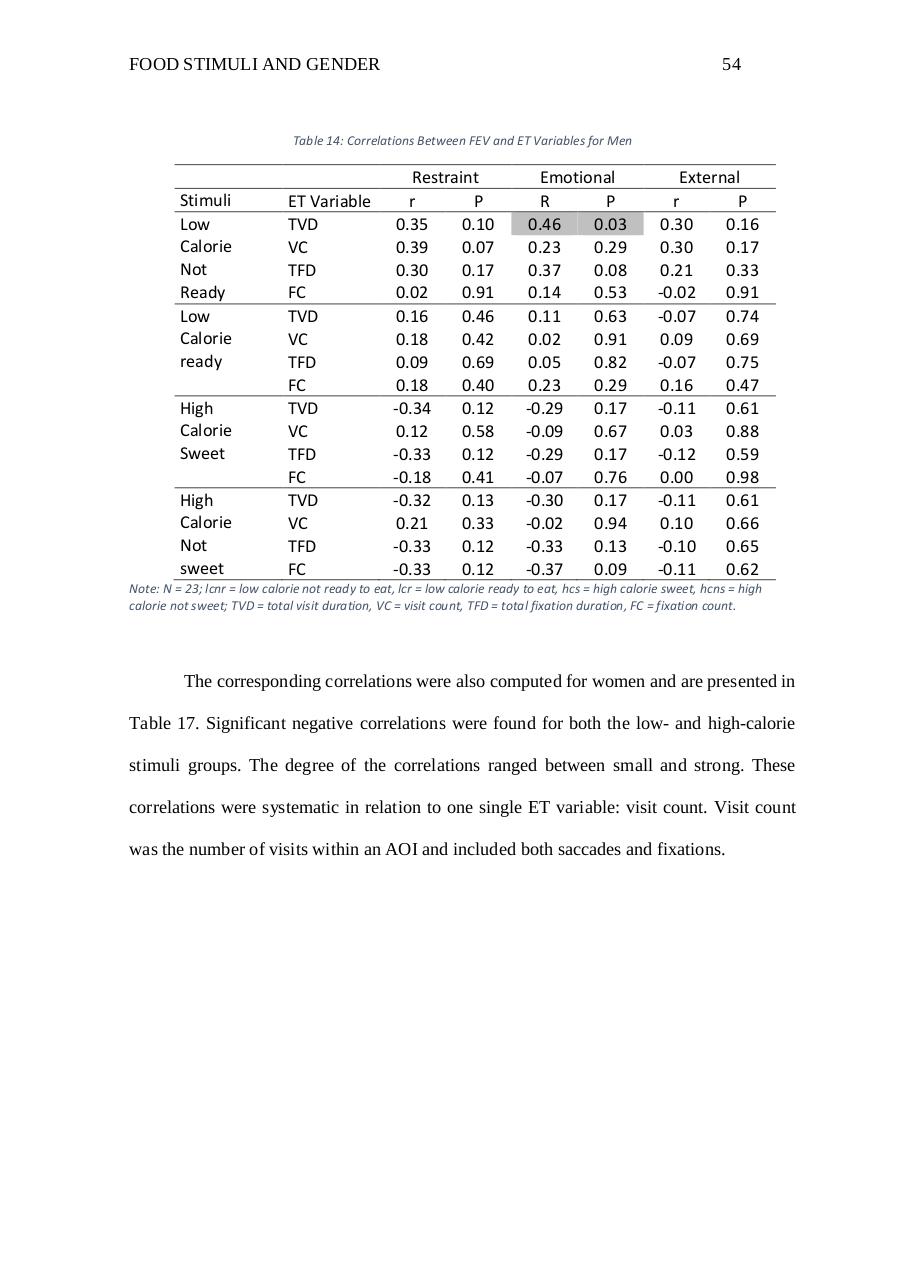
Table 14: Correlations Between FEV and ET Variables for Men
Stimuli
Low
Calorie
Not
Ready
Low
Calorie
ready
High
Calorie
Sweet
High
Calorie
Not
sweet
ET Variable
TVD
VC
TFD
FC
TVD
VC
TFD
FC
TVD
VC
TFD
FC
TVD
VC
TFD
FC
Restraint
r
P
0.35
0.10
0.39
0.07
0.30
0.17
0.02
0.91
0.16
0.46
0.18
0.42
0.09
0.69
0.18
0.40
-0.34
0.12
0.12
0.58
-0.33
0.12
-0.18
0.41
-0.32
0.13
0.21
0.33
-0.33
0.12
-0.33
0.12
Emotional
R
P
0.46
0.03
0.23
0.29
0.37
0.08
0.14
0.53
0.11
0.63
0.02
0.91
0.05
0.82
0.23
0.29
-0.29
0.17
-0.09
0.67
-0.29
0.17
-0.07
0.76
-0.30
0.17
-0.02
0.94
-0.33
0.13
-0.37
0.09
External
r
P
0.30
0.16
0.30
0.17
0.21
0.33
-0.02
0.91
-0.07
0.74
0.09
0.69
-0.07
0.75
0.16
0.47
-0.11
0.61
0.03
0.88
-0.12
0.59
0.00
0.98
-0.11
0.61
0.10
0.66
-0.10
0.65
-0.11
0.62
Note: N = 23; lcnr = low calorie not ready to eat, lcr = low calorie ready to eat, hcs = high calorie sweet, hcns = high
calorie not sweet; TVD = total visit duration, VC = visit count, TFD = total fixation duration, FC = fixation count.
The corresponding correlations were also computed for women and are presented in
Table 17. Significant negative correlations were found for both the low- and high-calorie
stimuli groups. The degree of the correlations ranged between small and strong. These
correlations were systematic in relation to one single ET variable: visit count. Visit count
was the number of visits within an AOI and included both saccades and fixations.