Tesla Motors 2015 03 31.pdf
Vista previa de texto
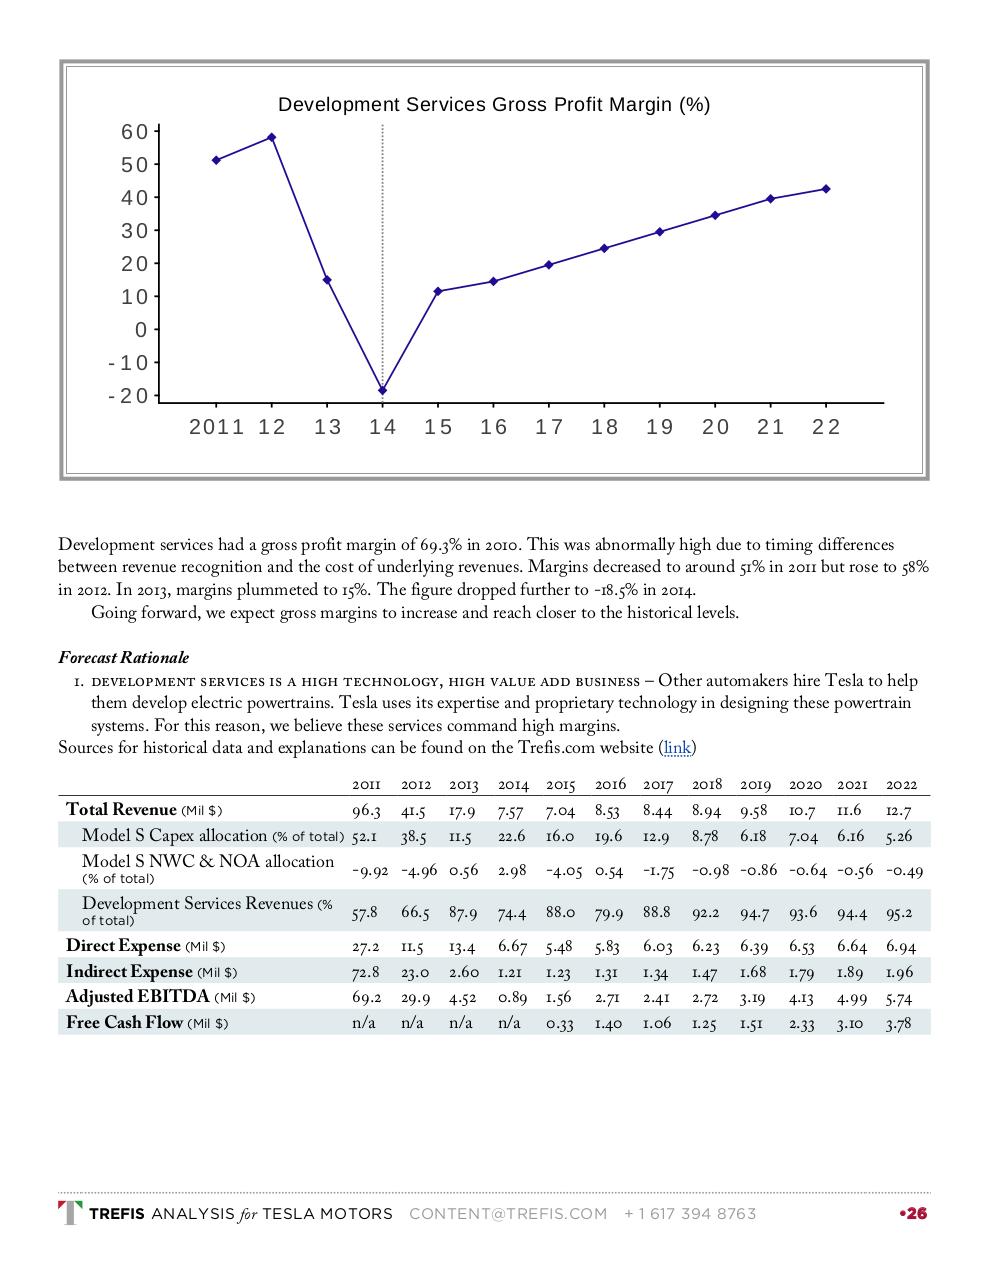
Development Services Gross Profit Margin (%)
60
50
40
30
20
10
0
-10
-20
2011 1 2
13
14
15
16
17
18
19
20
21
22
Development services had a gross profit margin of 69.3% in 2010. This was abnormally high due to timing differences
between revenue recognition and the cost of underlying revenues. Margins decreased to around 51% in 2011 but rose to 58%
in 2012. In 2013, margins plummeted to 15%. The figure dropped further to -18.5% in 2014.
Going forward, we expect gross margins to increase and reach closer to the historical levels.
Forecast Rationale
1. DEVELOPMENT SERVICES IS A HIGH TECHNOLOGY, HIGH VALUE ADD BUSINESS – Other automakers hire Tesla to help
them develop electric powertrains. Tesla uses its expertise and proprietary technology in designing these powertrain
systems. For this reason, we believe these services command high margins.
Sources for historical data and explanations can be found on the Trefis.com website (link)
2011
96.3
52.1
2012
41.5
38.5
2013
17.9
11.5
Total Revenue (Mil $)
Model S Capex allocation (% of total)
Model S NWC & NOA allocation -9.92 -4.96 0.56
(% of total)
Development Services Revenues (%
of total)
Direct Expense (Mil $)
Indirect Expense (Mil $)
Adjusted EBITDA (Mil $)
Free Cash Flow (Mil $)
2014 2015
7.57 7.04
22.6 16.0
2016 2017
8.53 8.44
19.6 12.9
2018
8.94
8.78
2019 2020 2021
9.58 10.7 11.6
6.18 7.04 6.16
2022
12.7
5.26
2.98
-4.05 0.54
-1.75 -0.98 -0.86 -0.64 -0.56 -0.49
57.8
66.5
87.9
74.4
88.0
79.9
88.8
92.2
94.7
93.6
94.4
95.2
27.2
72.8
69.2
n/a
11.5
23.0
29.9
n/a
13.4
2.60
4.52
n/a
6.67
1.21
0.89
n/a
5.48
1.23
1.56
0.33
5.83
1.31
2.71
1.40
6.03
1.34
2.41
1.06
6.23
1.47
2.72
1.25
6.39
1.68
3.19
1.51
6.53
1.79
4.13
2.33
6.64
1.89
4.99
3.10
6.94
1.96
5.74
3.78
TREFIS ANALYSIS for TESLA MOTORS
CONTENT@TREFIS.COM
+ 1 617 394 8763
•26