Tesla Motors 2015 03 31.pdf
Vista previa de texto
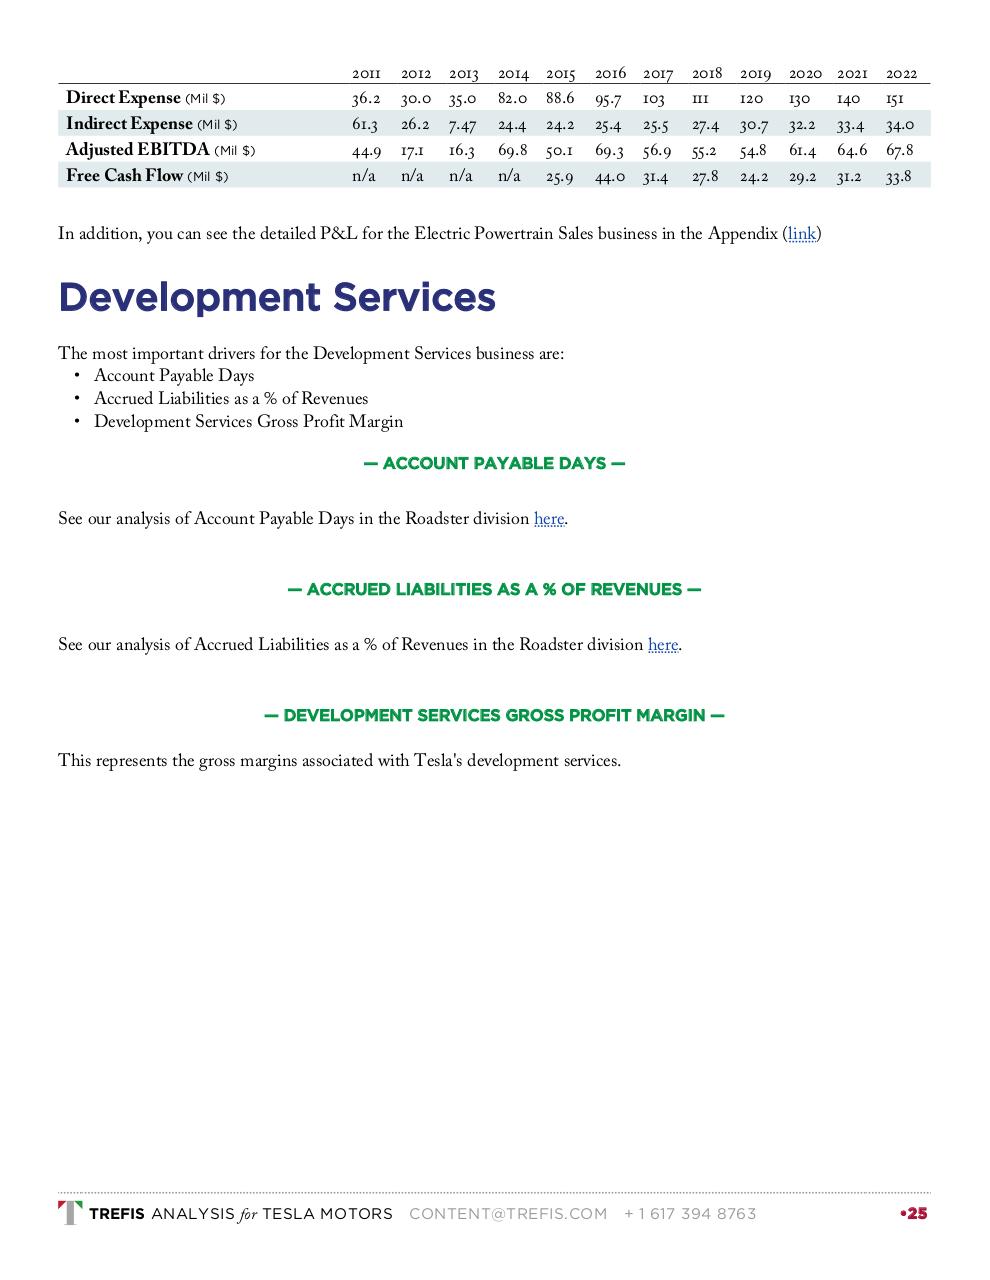
Direct Expense (Mil $)
Indirect Expense (Mil $)
Adjusted EBITDA (Mil $)
Free Cash Flow (Mil $)
2011
36.2
61.3
44.9
n/a
2012
30.0
26.2
17.1
n/a
2013
35.0
7.47
16.3
n/a
2014
82.0
24.4
69.8
n/a
2015
88.6
24.2
50.1
25.9
2016
95.7
25.4
69.3
44.0
2017
103
25.5
56.9
31.4
2018
111
27.4
55.2
27.8
2019
120
30.7
54.8
24.2
2020
130
32.2
61.4
29.2
2021
140
33.4
64.6
31.2
2022
151
34.0
67.8
33.8
In addition, you can see the detailed P&L for the Electric Powertrain Sales business in the Appendix (link)
Development Services
The most important drivers for the Development Services business are:
• Account Payable Days
• Accrued Liabilities as a % of Revenues
• Development Services Gross Profit Margin
— ACCOUNT PAYABLE DAYS —
See our analysis of Account Payable Days in the Roadster division here.
— ACCRUED LIABILITIES AS A % OF REVENUES —
See our analysis of Accrued Liabilities as a % of Revenues in the Roadster division here.
— DEVELOPMENT SERVICES GROSS PROFIT MARGIN —
This represents the gross margins associated with Tesla's development services.
TREFIS ANALYSIS for TESLA MOTORS
CONTENT@TREFIS.COM
+ 1 617 394 8763
•25