Tesla Motors 2015 03 31.pdf
Vista previa de texto
2011
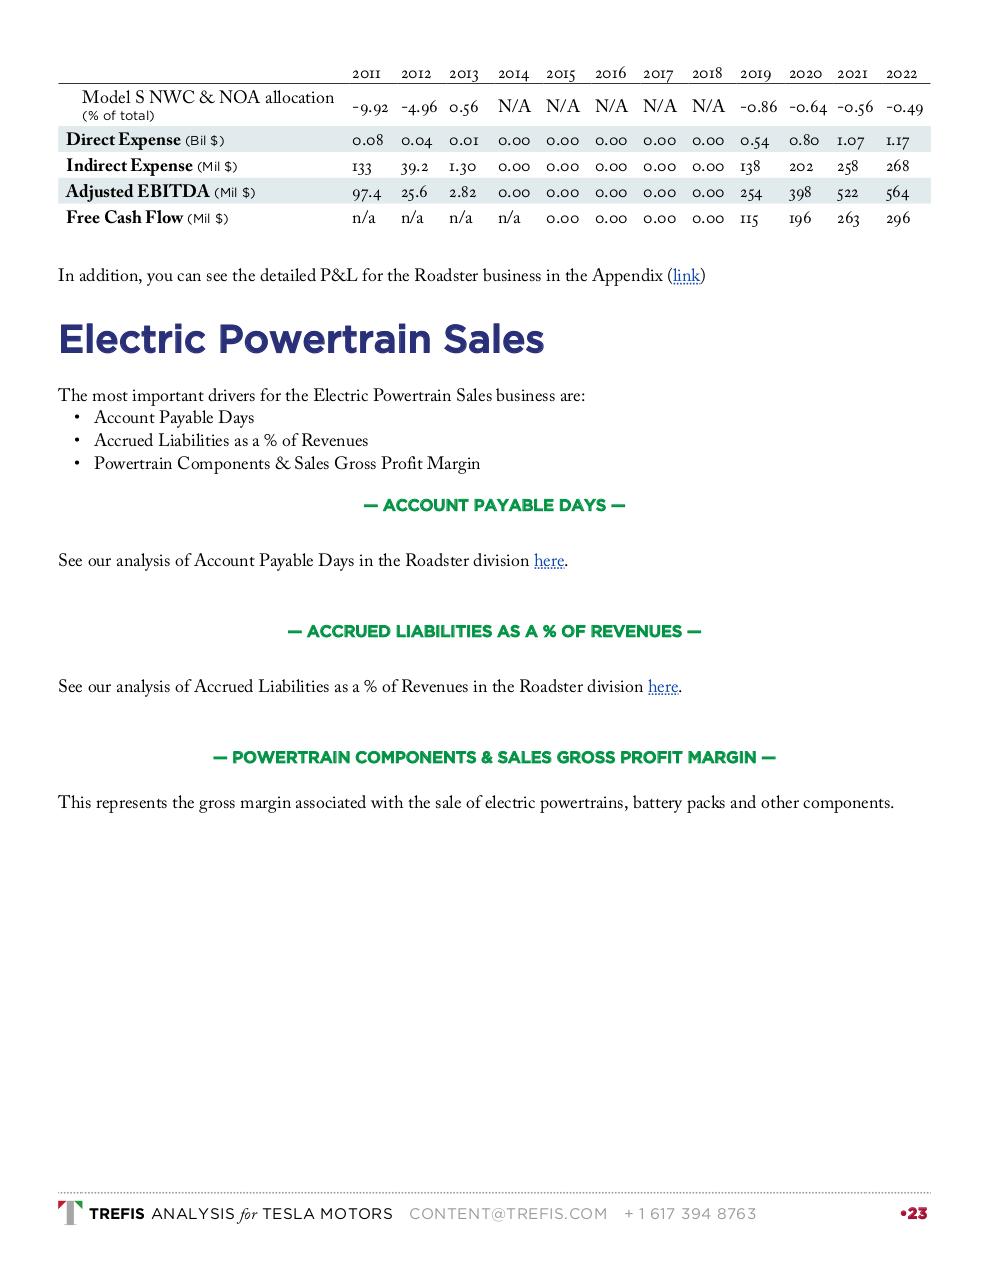
Model S NWC & NOA allocation
(% of total)
Direct Expense (Bil $)
Indirect Expense (Mil $)
Adjusted EBITDA (Mil $)
Free Cash Flow (Mil $)
2012
2013
2014 2015
2016 2017
2018
2019 2020 2021
2022
-9.92 -4.96 0.56
N/A N/A N/A N/A N/A -0.86 -0.64 -0.56 -0.49
0.08
133
97.4
n/a
0.00
0.00
0.00
n/a
0.04
39.2
25.6
n/a
0.01
1.30
2.82
n/a
0.00
0.00
0.00
0.00
0.00
0.00
0.00
0.00
0.00
0.00
0.00
0.00
0.00
0.00
0.00
0.00
0.54
138
254
115
0.80
202
398
196
1.07
258
522
263
1.17
268
564
296
In addition, you can see the detailed P&L for the Roadster business in the Appendix (link)
Electric Powertrain Sales
The most important drivers for the Electric Powertrain Sales business are:
• Account Payable Days
• Accrued Liabilities as a % of Revenues
• Powertrain Components & Sales Gross Profit Margin
— ACCOUNT PAYABLE DAYS —
See our analysis of Account Payable Days in the Roadster division here.
— ACCRUED LIABILITIES AS A % OF REVENUES —
See our analysis of Accrued Liabilities as a % of Revenues in the Roadster division here.
— POWERTRAIN COMPONENTS & SALES GROSS PROFIT MARGIN —
This represents the gross margin associated with the sale of electric powertrains, battery packs and other components.
TREFIS ANALYSIS for TESLA MOTORS
CONTENT@TREFIS.COM
+ 1 617 394 8763
•23