Tesla Motors 2015 03 31.pdf
Vista previa de texto
Summary P&L for Tesla Motors continued
2011 2012
Development Services (% of total)
n/a n/a
2013
n/a
2014 2015 2016 2017 2018 2019 2020 2021
n/a 0.02 0.04 0.04 0.04 0.04 0.04 0.05
2022
0.05
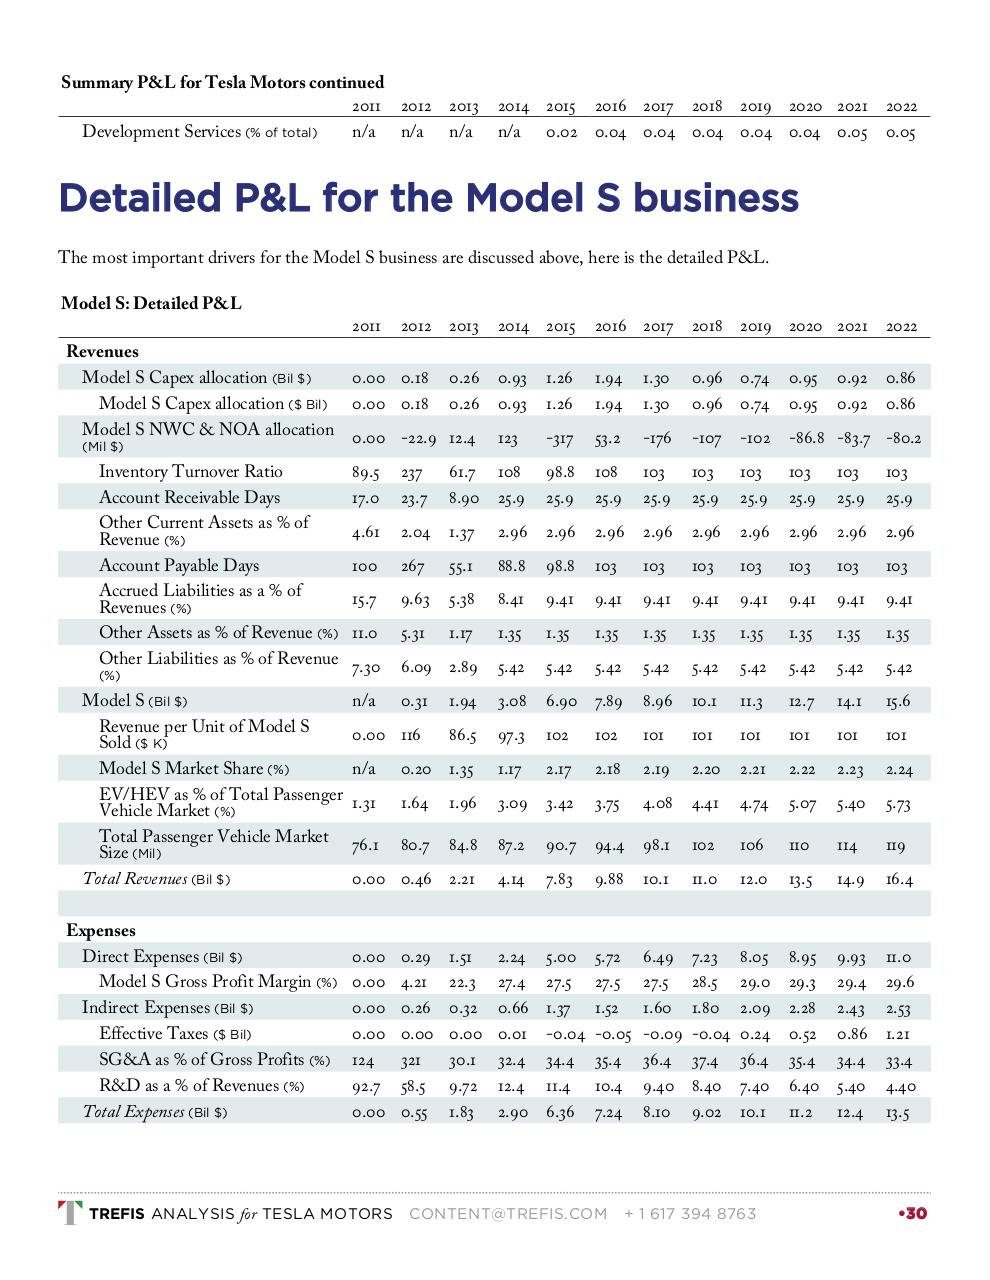
Detailed P&L for the Model S business
The most important drivers for the Model S business are discussed above, here is the detailed P&L.
Model S: Detailed P&L
2011
Revenues
Model S Capex allocation (Bil $)
Model S Capex allocation ($ Bil)
Model S NWC & NOA allocation
(Mil $)
Inventory Turnover Ratio
Account Receivable Days
Other Current Assets as % of
Revenue (%)
Account Payable Days
Accrued Liabilities as a % of
Revenues (%)
Other Assets as % of Revenue (%)
Other Liabilities as % of Revenue
(%)
Model S (Bil $)
Revenue per Unit of Model S
Sold ($ K)
Model S Market Share (%)
EV/HEV as % of Total Passenger
Vehicle Market (%)
Total Passenger Vehicle Market
Size (Mil)
Total Revenues (Bil $)
Expenses
Direct Expenses (Bil $)
Model S Gross Profit Margin (%)
Indirect Expenses (Bil $)
Effective Taxes ($ Bil)
SG&A as % of Gross Profits (%)
R&D as a % of Revenues (%)
Total Expenses (Bil $)
2012
2013
2014 2015
2016 2017
2018
0.00 0.18
0.00 0.18
0.26
0.26
0.93
0.93
1.26
1.26
1.94
1.94
1.30
1.30
0.96 0.74
0.96 0.74
0.95
0.95
0.00 -22.9 12.4
123
-317
53.2
-176
-107
-102
-86.8 -83.7 -80.2
89.5
17.0
237
23.7
61.7
8.90
108
25.9
98.8
25.9
108
25.9
103
25.9
103
25.9
103
25.9
103
25.9
103
25.9
103
25.9
4.61
2.04
1.37
2.96
2.96
2.96
2.96
2.96
2.96
2.96
2.96
2.96
100
267
55.1
88.8
98.8
103
103
103
103
103
103
103
15.7
9.63
5.38
8.41
9.41
9.41
9.41
9.41
9.41
9.41
9.41
9.41
11.0
5.31
1.17
1.35
1.35
1.35
1.35
1.35
1.35
1.35
1.35
1.35
7.30
6.09 2.89
5.42
5.42
5.42
5.42
5.42
5.42
5.42
5.42
5.42
n/a
0.31
1.94
3.08
6.90 7.89
8.96
10.1
11.3
12.7
14.1
15.6
86.5
97.3
102
102
101
101
101
101
101
101
n/a
0.20 1.35
1.17
2.17
2.18
2.19
2.20
2.21
2.22
2.23
2.24
1.31
1.64
1.96
3.09
3.42
3.75
4.08
4.41
4.74
5.07
5.40
5.73
76.1
80.7
84.8
87.2
90.7
94.4
98.1
102
106
110
114
119
0.00 0.46 2.21
4.14
7.83
9.88
10.1
11.0
12.0
13.5
14.9
16.4
0.00
0.00
0.00
0.00
124
92.7
0.00
2.24
27.4
0.66
0.01
32.4
12.4
2.90
5.00
27.5
1.37
-0.04
34.4
11.4
6.36
5.72
27.5
1.52
-0.05
35.4
10.4
7.24
6.49
27.5
1.60
-0.09
36.4
9.40
8.10
7.23
28.5
1.80
-0.04
37.4
8.40
9.02
8.05
29.0
2.09
0.24
36.4
7.40
10.1
8.95
29.3
2.28
0.52
35.4
6.40
11.2
9.93
29.4
2.43
0.86
34.4
5.40
12.4
11.0
29.6
2.53
1.21
33.4
4.40
13.5
0.00 116
TREFIS ANALYSIS for TESLA MOTORS
0.29
4.21
0.26
0.00
321
58.5
0.55
1.51
22.3
0.32
0.00
30.1
9.72
1.83
CONTENT@TREFIS.COM
2019 2020 2021
+ 1 617 394 8763
0.92
0.92
2022
0.86
0.86
•30