Tesla Motors 2015 03 31.pdf
Vista previa de texto
Appendix
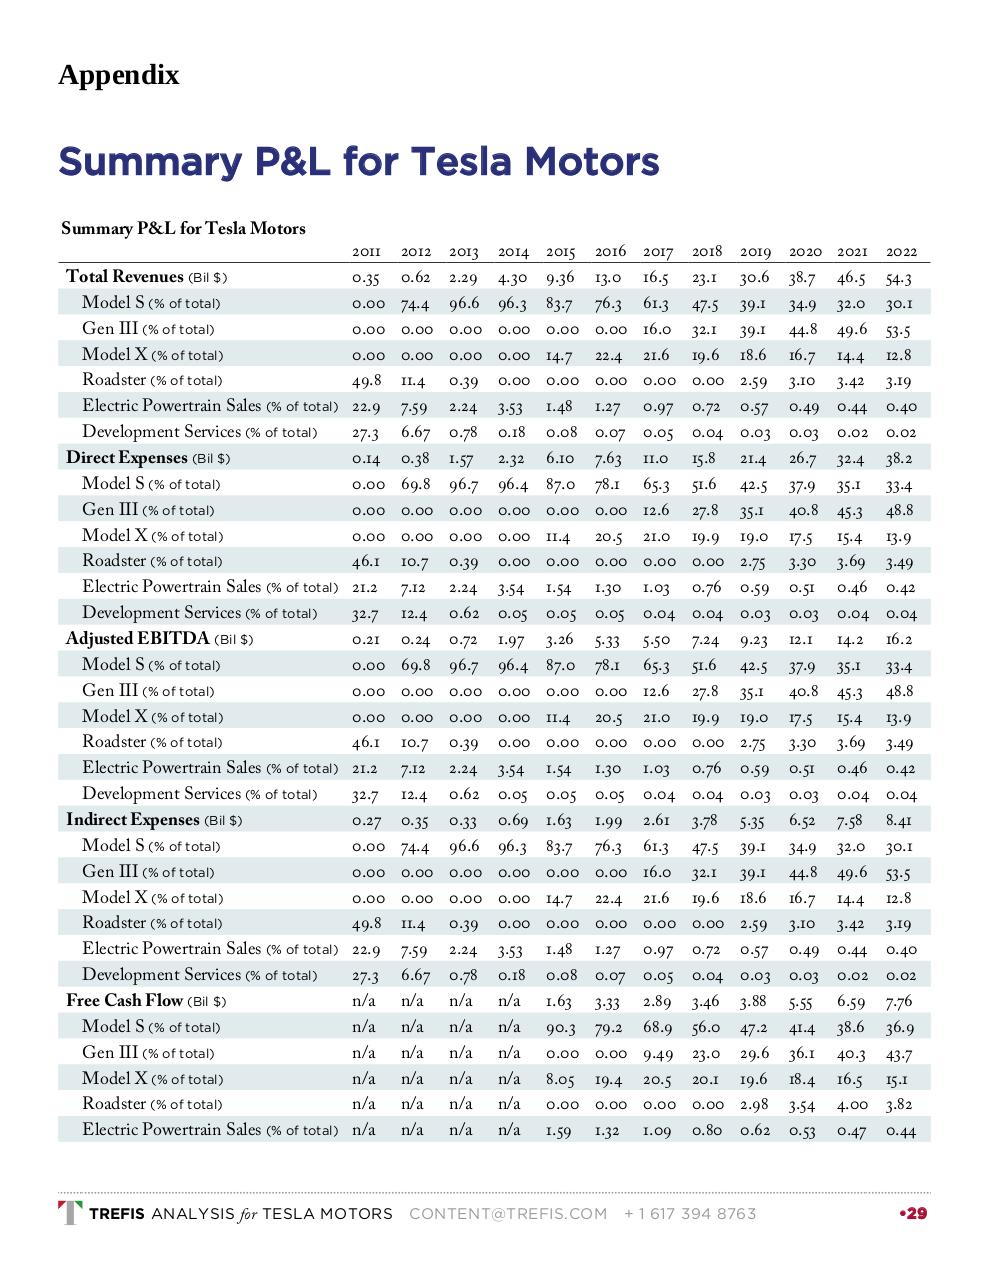
Summary P&L for Tesla Motors
Summary P&L for Tesla Motors
Total Revenues (Bil $)
Model S (% of total)
Gen III (% of total)
Model X (% of total)
Roadster (% of total)
Electric Powertrain Sales (% of total)
Development Services (% of total)
Direct Expenses (Bil $)
Model S (% of total)
Gen III (% of total)
Model X (% of total)
Roadster (% of total)
Electric Powertrain Sales (% of total)
Development Services (% of total)
Adjusted EBITDA (Bil $)
Model S (% of total)
Gen III (% of total)
Model X (% of total)
Roadster (% of total)
Electric Powertrain Sales (% of total)
Development Services (% of total)
Indirect Expenses (Bil $)
Model S (% of total)
Gen III (% of total)
Model X (% of total)
Roadster (% of total)
Electric Powertrain Sales (% of total)
Development Services (% of total)
Free Cash Flow (Bil $)
Model S (% of total)
Gen III (% of total)
Model X (% of total)
Roadster (% of total)
Electric Powertrain Sales (% of total)
2011
0.35
0.00
0.00
0.00
49.8
22.9
27.3
0.14
0.00
0.00
0.00
46.1
21.2
32.7
0.21
0.00
0.00
0.00
46.1
21.2
32.7
0.27
0.00
0.00
0.00
49.8
22.9
27.3
n/a
n/a
n/a
n/a
n/a
n/a
TREFIS ANALYSIS for TESLA MOTORS
2012
0.62
74.4
0.00
0.00
11.4
7.59
6.67
0.38
69.8
0.00
0.00
10.7
7.12
12.4
0.24
69.8
0.00
0.00
10.7
7.12
12.4
0.35
74.4
0.00
0.00
11.4
7.59
6.67
n/a
n/a
n/a
n/a
n/a
n/a
2013
2.29
96.6
0.00
0.00
0.39
2.24
0.78
1.57
96.7
0.00
0.00
0.39
2.24
0.62
0.72
96.7
0.00
0.00
0.39
2.24
0.62
0.33
96.6
0.00
0.00
0.39
2.24
0.78
n/a
n/a
n/a
n/a
n/a
n/a
2014
4.30
96.3
0.00
0.00
0.00
3.53
0.18
2.32
96.4
0.00
0.00
0.00
3.54
0.05
1.97
96.4
0.00
0.00
0.00
3.54
0.05
0.69
96.3
0.00
0.00
0.00
3.53
0.18
n/a
n/a
n/a
n/a
n/a
n/a
2015
9.36
83.7
0.00
14.7
0.00
1.48
0.08
6.10
87.0
0.00
11.4
0.00
1.54
0.05
3.26
87.0
0.00
11.4
0.00
1.54
0.05
1.63
83.7
0.00
14.7
0.00
1.48
0.08
1.63
90.3
0.00
8.05
0.00
1.59
2016
13.0
76.3
0.00
22.4
0.00
1.27
0.07
7.63
78.1
0.00
20.5
0.00
1.30
0.05
5.33
78.1
0.00
20.5
0.00
1.30
0.05
1.99
76.3
0.00
22.4
0.00
1.27
0.07
3.33
79.2
0.00
19.4
0.00
1.32
CONTENT@TREFIS.COM
2017
16.5
61.3
16.0
21.6
0.00
0.97
0.05
11.0
65.3
12.6
21.0
0.00
1.03
0.04
5.50
65.3
12.6
21.0
0.00
1.03
0.04
2.61
61.3
16.0
21.6
0.00
0.97
0.05
2.89
68.9
9.49
20.5
0.00
1.09
2018
23.1
47.5
32.1
19.6
0.00
0.72
0.04
15.8
51.6
27.8
19.9
0.00
0.76
0.04
7.24
51.6
27.8
19.9
0.00
0.76
0.04
3.78
47.5
32.1
19.6
0.00
0.72
0.04
3.46
56.0
23.0
20.1
0.00
0.80
2019
30.6
39.1
39.1
18.6
2.59
0.57
0.03
21.4
42.5
35.1
19.0
2.75
0.59
0.03
9.23
42.5
35.1
19.0
2.75
0.59
0.03
5.35
39.1
39.1
18.6
2.59
0.57
0.03
3.88
47.2
29.6
19.6
2.98
0.62
+ 1 617 394 8763
2020
38.7
34.9
44.8
16.7
3.10
0.49
0.03
26.7
37.9
40.8
17.5
3.30
0.51
0.03
12.1
37.9
40.8
17.5
3.30
0.51
0.03
6.52
34.9
44.8
16.7
3.10
0.49
0.03
5.55
41.4
36.1
18.4
3.54
0.53
2021
46.5
32.0
49.6
14.4
3.42
0.44
0.02
32.4
35.1
45.3
15.4
3.69
0.46
0.04
14.2
35.1
45.3
15.4
3.69
0.46
0.04
7.58
32.0
49.6
14.4
3.42
0.44
0.02
6.59
38.6
40.3
16.5
4.00
0.47
2022
54.3
30.1
53.5
12.8
3.19
0.40
0.02
38.2
33.4
48.8
13.9
3.49
0.42
0.04
16.2
33.4
48.8
13.9
3.49
0.42
0.04
8.41
30.1
53.5
12.8
3.19
0.40
0.02
7.76
36.9
43.7
15.1
3.82
0.44
•29