Tesla Motors 2015 03 31.pdf
Vista previa de texto
Model S gross margins.
Forecast Rationale
Supporting:
Mitigating:
1. HIGH END VARIANTS OF THE MODEL S WILL HAVE HIGHER MARGINS – The Model S is available in a price range from
$60,000-100,000. The high end variants offer larger battery packs and premium features such as better interiors,
improved suspension, and carbon fiber spoilers. This will help command higher margins.
2. DECLINING BATTERY COSTS – The costs of electric vehicle batteries are expected to decline substantially over the
course of this decade due to improving technology and battery makers achieving economies of scale. Batteries make
up a substantial portion of the total manufacturing costs of EVs, and a decline in these costs can considerably boost
margins.
3. According to a 2012 McKinsey study, the price of a lithium-ion battery pack could drop from $500-$600 per kiloWatt
hour(kWh) to about $200 per kWh in 2020 and $160 by 2025.
4. ECONOMIES OF SCALE – Once Tesla ramps up production of the Model S, costs will be substantially reduced due to
economies of scale, thereby leading to higher margins.
5. COMPETITION CAN FORCE TESLA TO REDUCE PRICES – The EV market is expected to grow at an exponential rate over
the next several years. A large number of competitors are bound to emerge, and considering the fact that Tesla is a
relatively new brand, customers may prefer to purchase EV's manufactured by trusted brands. This could force Tesla
to decrease prices in order to maintain its market share, thereby reducing margins.
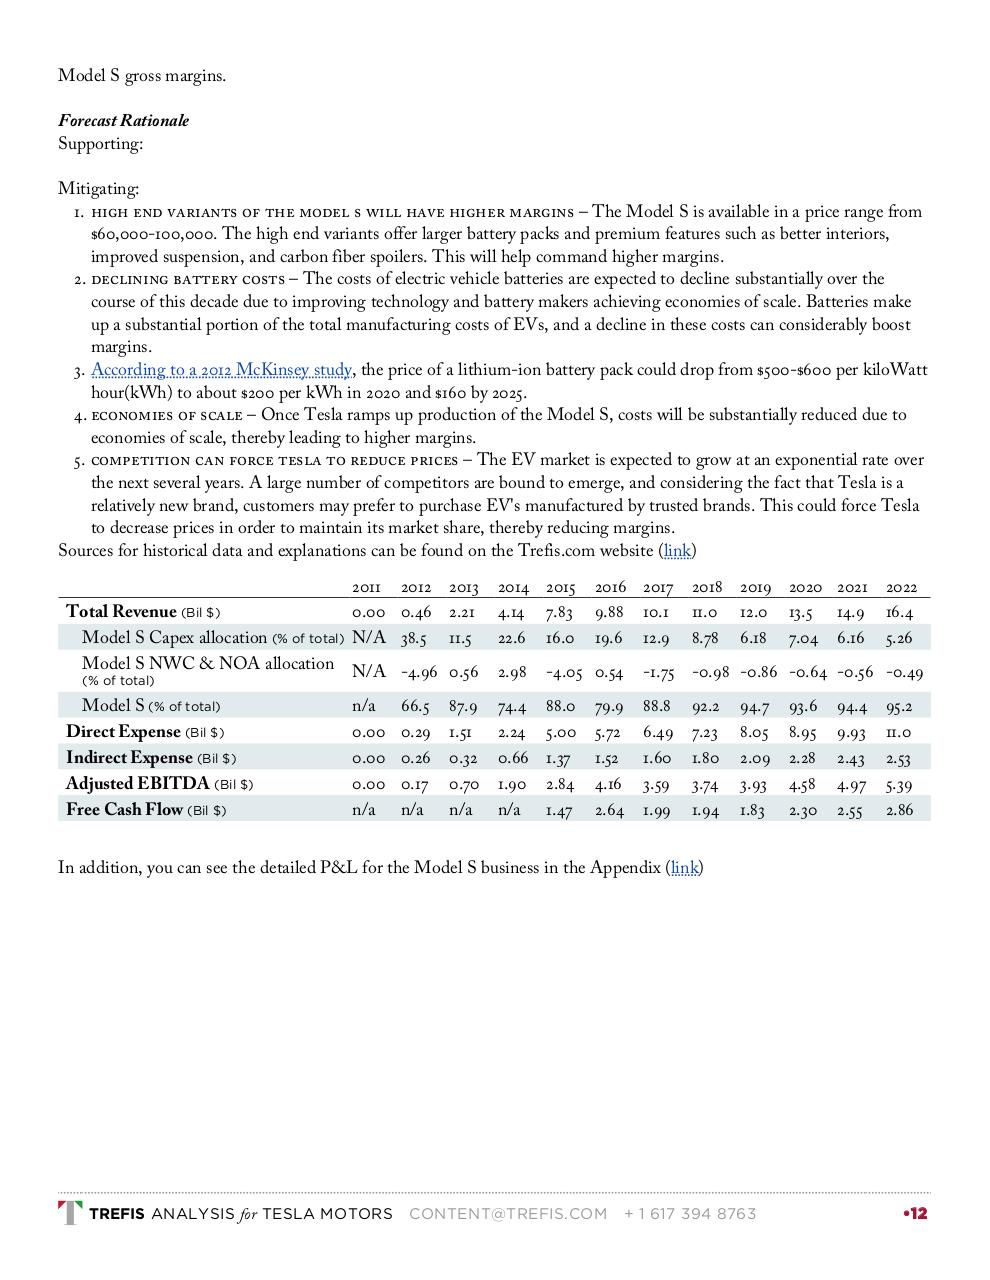
Sources for historical data and explanations can be found on the Trefis.com website (link)
2011 2012 2013
0.00 0.46 2.21
N/A 38.5 11.5
Total Revenue (Bil $)
Model S Capex allocation (% of total)
Model S NWC & NOA allocation N/A -4.96 0.56
(% of total)
Model S (% of total)
Direct Expense (Bil $)
Indirect Expense (Bil $)
Adjusted EBITDA (Bil $)
Free Cash Flow (Bil $)
n/a
0.00
0.00
0.00
n/a
66.5
0.29
0.26
0.17
n/a
87.9
1.51
0.32
0.70
n/a
2014 2015
4.14 7.83
22.6 16.0
2016 2017
9.88 10.1
19.6 12.9
2018
11.0
8.78
2019 2020 2021
12.0 13.5 14.9
6.18 7.04 6.16
2022
16.4
5.26
2.98
-4.05 0.54
-1.75 -0.98 -0.86 -0.64 -0.56 -0.49
74.4
2.24
0.66
1.90
n/a
88.0
5.00
1.37
2.84
1.47
88.8
6.49
1.60
3.59
1.99
79.9
5.72
1.52
4.16
2.64
92.2
7.23
1.80
3.74
1.94
94.7
8.05
2.09
3.93
1.83
93.6
8.95
2.28
4.58
2.30
94.4
9.93
2.43
4.97
2.55
95.2
11.0
2.53
5.39
2.86
In addition, you can see the detailed P&L for the Model S business in the Appendix (link)
TREFIS ANALYSIS for TESLA MOTORS
CONTENT@TREFIS.COM
+ 1 617 394 8763
•12