Tesla Motors 2015 03 31.pdf
Vista previa de texto
2011 2012 2013 2014 2015
0.00 0.00 0.00 0.00 1.38
N/A N/A N/A N/A 16.0
2016 2017
2.90 3.56
19.6 12.9
2018
4.53
8.78
2019 2020 2021
5.69 6.46 6.72
6.18 7.04 6.16
2022
6.93
5.26
Total Revenue (Bil $)
Model S Capex allocation (% of total)
Model S NWC & NOA allocation N/A N/A N/A N/A -4.05 0.54
(% of total)
-1.75 -0.98 -0.86 -0.64 -0.56 -0.49
Model X (% of total)
Direct Expense (Bil $)
Indirect Expense (Bil $)
Adjusted EBITDA (Bil $)
Free Cash Flow (Bil $)
88.8
2.40
0.57
1.16
0.59
N/A
0.00
0.00
0.00
n/a
N/A
0.00
0.00
0.00
n/a
N/A
0.00
0.00
0.00
n/a
N/A
0.00
0.00
0.00
n/a
88.0
1.01
0.24
0.37
0.13
79.9
1.81
0.45
1.09
0.65
92.2
3.09
0.74
1.44
0.70
94.7
3.93
1.00
1.76
0.76
93.6
4.36
1.09
2.11
1.02
94.4
4.54
1.09
2.18
1.09
95.2
4.69
1.07
2.25
1.17
In addition, you can see the detailed P&L for the Model X business in the Appendix (link)
Roadster
The most important drivers for the Roadster business are:
• Account Payable Days
• Accrued Liabilities as a % of Revenues
• Roadster Gross Profit Margin
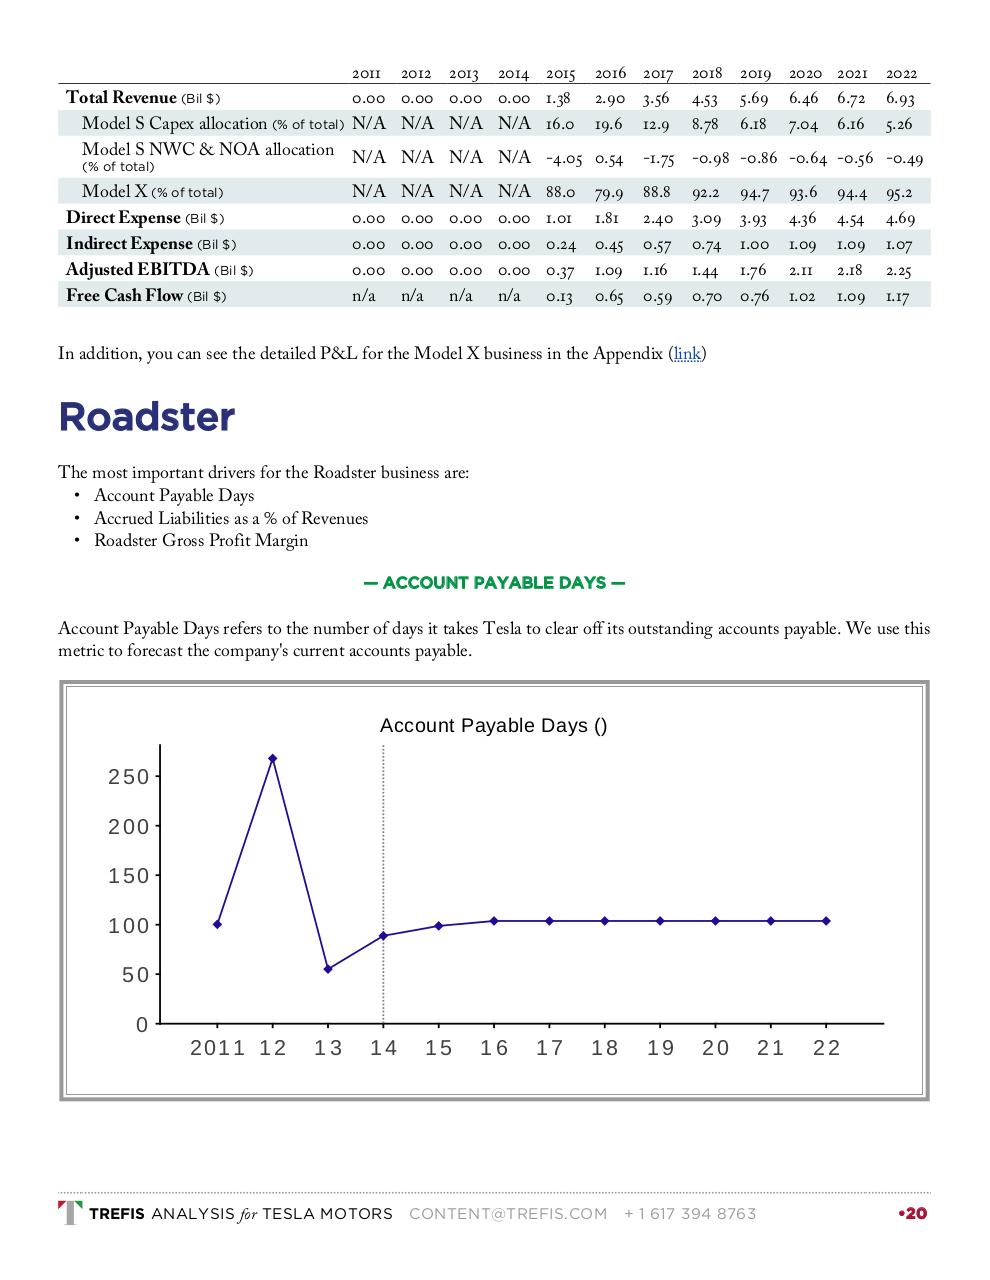
— ACCOUNT PAYABLE DAYS —
Account Payable Days refers to the number of days it takes Tesla to clear off its outstanding accounts payable. We use this
metric to forecast the company's current accounts payable.
Account Payable Days ()
250
200
150
100
50
0
2011 1 2
13
14
TREFIS ANALYSIS for TESLA MOTORS
15
16
17
18
CONTENT@TREFIS.COM
19
20
+ 1 617 394 8763
21
22
•20