Tesla Motors 2015 03 31.pdf
Vista previa de texto
2011
0.00
N/A
N/A
2012
0.00
N/A
N/A
2013
0.00
N/A
N/A
2014
0.00
N/A
N/A
2015
0.00
N/A
N/A
2016
0.00
N/A
N/A
2017
2.64
12.9
88.8
2018
7.40
8.78
92.2
2019
12.0
6.18
94.7
2020
17.3
7.04
93.6
2021
23.1
6.16
94.4
2022
29.1
5.26
95.2
0.00
0.00
0.00
n/a
0.00
0.00
0.00
n/a
0.00
0.00
0.00
n/a
0.00
0.00
0.00
n/a
0.00
0.00
0.00
0.00
0.00
0.00
0.00
0.00
1.95
0.42
0.69
0.27
5.39
1.21
2.01
0.80
8.72
2.09
3.24
1.15
12.4
2.92
4.93
2.01
16.7
3.76
6.42
2.66
21.2
4.50
7.89
3.39
Total Revenue (Bil $)
Model S Capex allocation (% of total)
Gen III (% of total)
Model S NWC & NOA allocation N/A N/A N/A N/A N/A N/A -1.75 -0.98 -0.86 -0.64 -0.56 -0.49
(% of total)
Direct Expense (Bil $)
Indirect Expense (Bil $)
Adjusted EBITDA (Bil $)
Free Cash Flow (Bil $)
In addition, you can see the detailed P&L for the Gen III business in the Appendix (link)
Model X
The most important drivers for the Model X business are:
• Model X
• Model X Gross Profit Margin
— MODEL X —
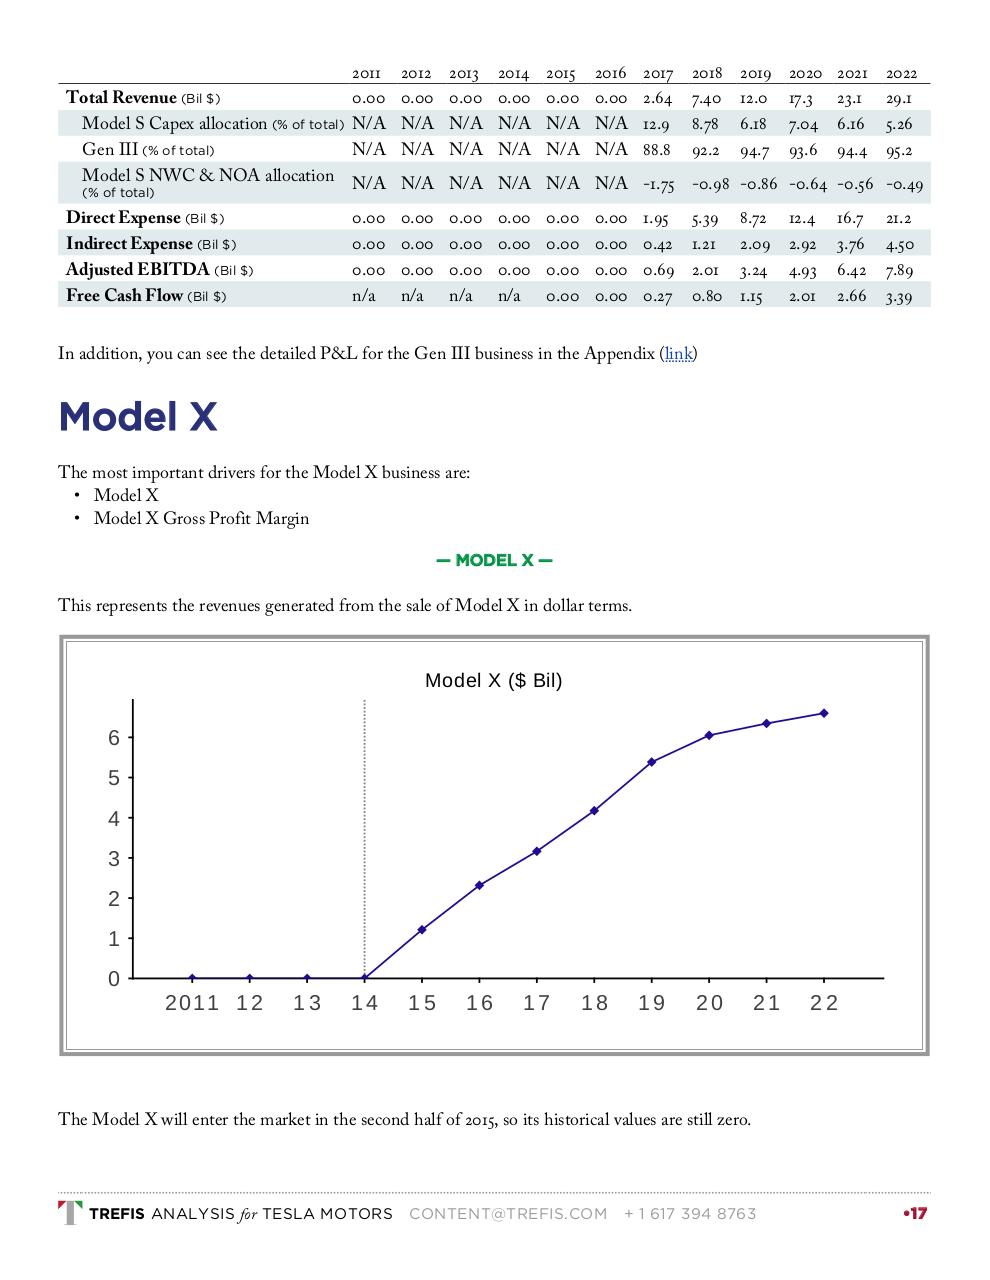
This represents the revenues generated from the sale of Model X in dollar terms.
Model X ($ Bil)
6
5
4
3
2
1
0
2011 1 2
13
14
15
16
17
18
19
20
21
22
The Model X will enter the market in the second half of 2015, so its historical values are still zero.
TREFIS ANALYSIS for TESLA MOTORS
CONTENT@TREFIS.COM
+ 1 617 394 8763
•17