Masterarbeit SS 1.2 Final.pdf
Vista previa de texto
FOOD STIMULI AND GENDER
40
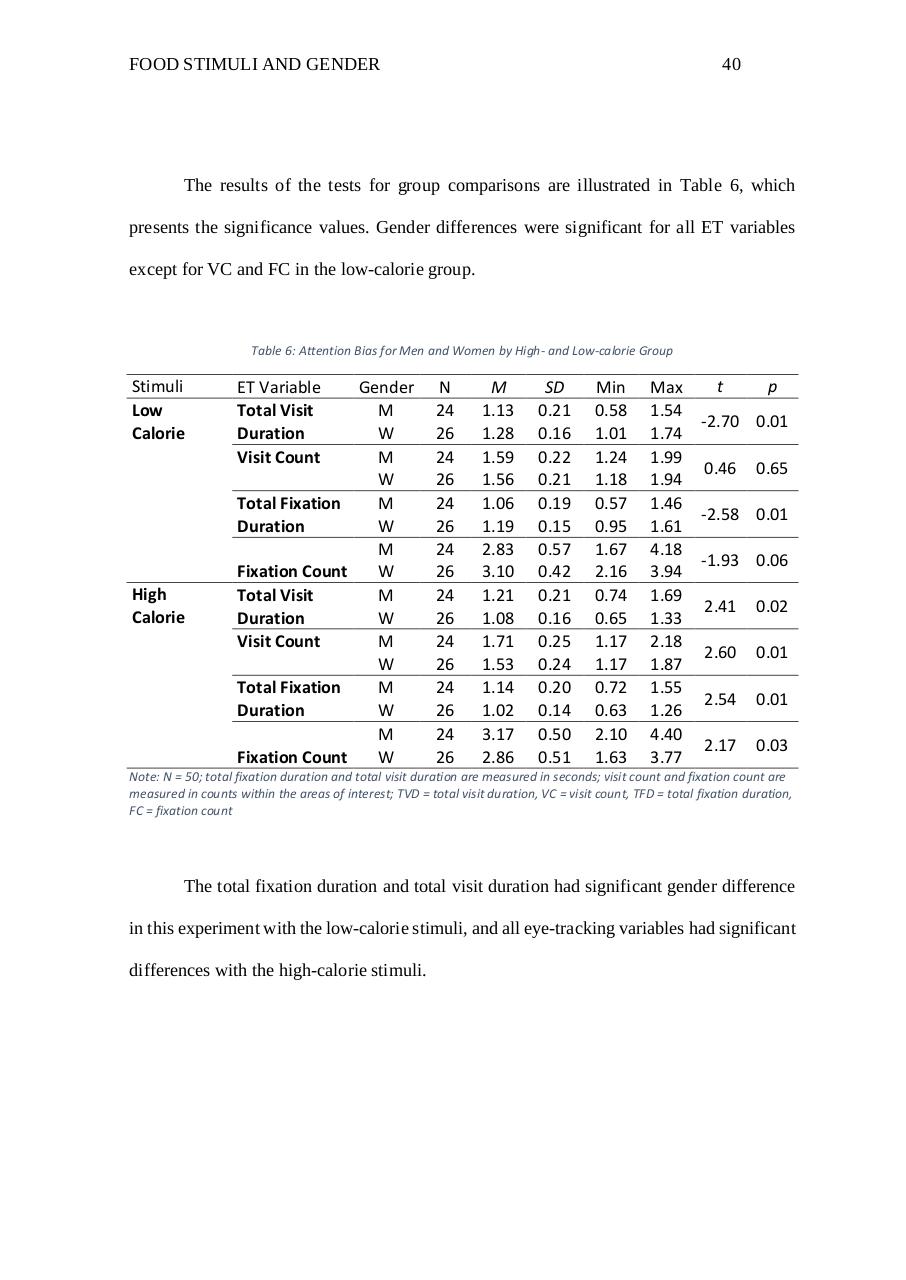
The results of the tests for group comparisons are illustrated in Table 6, which
presents the significance values. Gender differences were significant for all ET variables
except for VC and FC in the low-calorie group.
Table 6: Attention Bias for Men and Women by High- and Low-calorie Group
Stimuli
Low
Calorie
ET Variable
Total Visit
Duration
Visit Count
Total Fixation
Duration
High
Calorie
Fixation Count
Total Visit
Duration
Visit Count
Total Fixation
Duration
Fixation Count
Gender
M
W
M
W
M
W
M
W
M
W
M
W
M
W
M
W
N
24
26
24
26
24
26
24
26
24
26
24
26
24
26
24
26
M
1.13
1.28
1.59
1.56
1.06
1.19
2.83
3.10
1.21
1.08
1.71
1.53
1.14
1.02
3.17
2.86
SD
0.21
0.16
0.22
0.21
0.19
0.15
0.57
0.42
0.21
0.16
0.25
0.24
0.20
0.14
0.50
0.51
Min
0.58
1.01
1.24
1.18
0.57
0.95
1.67
2.16
0.74
0.65
1.17
1.17
0.72
0.63
2.10
1.63
Max
1.54
1.74
1.99
1.94
1.46
1.61
4.18
3.94
1.69
1.33
2.18
1.87
1.55
1.26
4.40
3.77
t
p
-2.70 0.01
0.46
0.65
-2.58 0.01
-1.93 0.06
2.41
0.02
2.60
0.01
2.54
0.01
2.17
0.03
Note: N = 50; total fixation duration and total visit duration are measured in seconds; visit count and fixation count are
measured in counts within the areas of interest; TVD = total visit duration, VC = visit count, TFD = total fixation duration,
FC = fixation count
The total fixation duration and total visit duration had significant gender difference
in this experiment with the low-calorie stimuli, and all eye-tracking variables had significant
differences with the high-calorie stimuli.