Aberration 24 Full Jan 15.pdf
Vista previa de texto
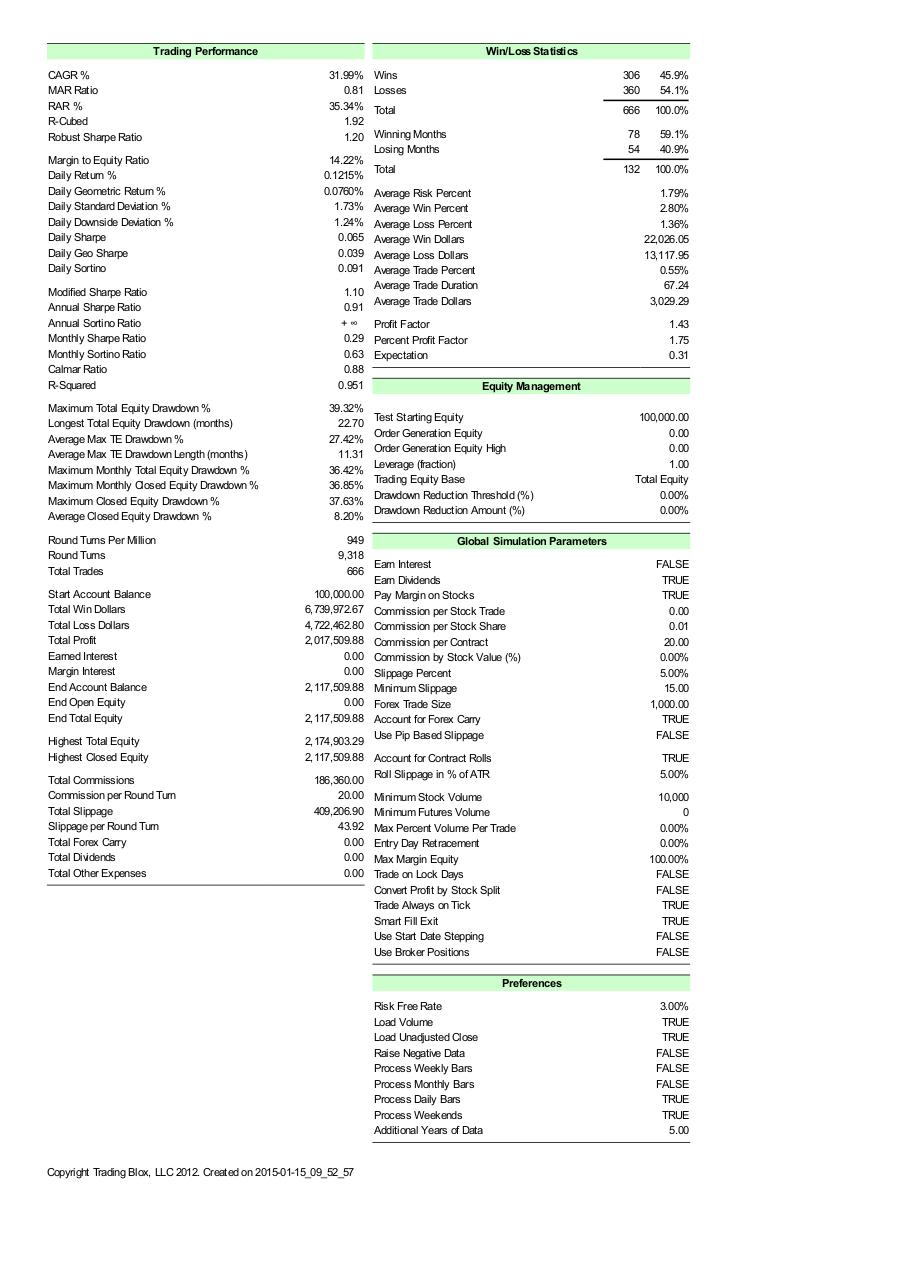
Trading Performance
CAGR %
MAR Ratio
RAR %
R-Cubed
Robust Sharpe Ratio
Margin to Equity Ratio
Daily Return %
Daily Geometric Return %
Daily Standard Deviation %
Daily Downside Deviation %
Daily Sharpe
Daily Geo Sharpe
Daily Sortino
Modified Sharpe Ratio
Annual Sharpe Ratio
Annual Sortino Ratio
Monthly Sharpe Ratio
Monthly Sortino Ratio
Calmar Ratio
R-Squared
Maximum Total Equity Drawdown %
Longest Total Equity Drawdown (months)
Average Max TE Drawdown %
Average Max TE Drawdown Length (months)
Maximum Monthly Total Equity Drawdown %
Maximum Monthly Closed Equity Drawdown %
Maximum Closed Equity Drawdown %
Average Closed Equity Drawdown %
Round Turns Per Million
Round Turns
Total Trades
Start Account Balance
Total Win Dollars
Total Loss Dollars
Total Profit
Earned Interest
Margin Interest
End Account Balance
End Open Equity
End Total Equity
Highest Total Equity
Highest Closed Equity
Total Commissions
Commission per Round Turn
Total Slippage
Slippage per Round Turn
Total Forex Carry
Total Dividends
Total Other Expenses
Win/Loss Statistics
31.99%
0.81
35.34%
1.92
1.20
14.22%
0.1215%
0.0760%
1.73%
1.24%
0.065
0.039
0.091
Wins
Losses
306
360
45.9%
54.1%
Total
666
100.0%
78
54
59.1%
40.9%
132
100.0%
Winning Months
Losing Months
Total
Average Risk Percent
Average Win Percent
Average Loss Percent
Average Win Dollars
Average Loss Dollars
Average Trade Percent
Average Trade Duration
1.10
Average Trade Dollars
0.91
+ ∞ Profit Factor
0.29 Percent Profit Factor
0.63 Expectation
0.88
0.951
Equity Management
39.32%
22.70
27.42%
11.31
36.42%
36.85%
37.63%
8.20%
Test Starting Equity
Order Generation Equity
Order Generation Equity High
Leverage (fraction)
Trading Equity Base
Drawdown Reduction Threshold (%)
Drawdown Reduction Amount (%)
949
Global Simulation Parameters
9,318
Earn Interest
666
Earn Dividends
100,000.00 Pay Margin on Stocks
6,739,972.67 Commission per Stock Trade
4,722,462.80 Commission per Stock Share
2,017,509.88 Commission per Contract
0.00 Commission by Stock Value (%)
0.00 Slippage Percent
2,117,509.88 Minimum Slippage
0.00 Forex Trade Size
2,117,509.88 Account for Forex Carry
Use Pip Based Slippage
2,174,903.29
2,117,509.88 Account for Contract Rolls
Roll Slippage in % of ATR
186,360.00
20.00 Minimum Stock Volume
409,206.90 Minimum Futures Volume
43.92 Max Percent Volume Per Trade
0.00 Entry Day Retracement
0.00 Max Margin Equity
0.00 Trade on Lock Days
Convert Profit by Stock Split
Trade Always on Tick
Smart Fill Exit
Use Start Date Stepping
Use Broker Positions
1.79%
2.80%
1.36%
22,026.05
13,117.95
0.55%
67.24
3,029.29
1.43
1.75
0.31
100,000.00
0.00
0.00
1.00
Total Equity
0.00%
0.00%
FALSE
TRUE
TRUE
0.00
0.01
20.00
0.00%
5.00%
15.00
1,000.00
TRUE
FALSE
TRUE
5.00%
10,000
0
0.00%
0.00%
100.00%
FALSE
FALSE
TRUE
TRUE
FALSE
FALSE
Preferences
Risk Free Rate
Load Volume
Load Unadjusted Close
Raise Negative Data
Process Weekly Bars
Process Monthly Bars
Process Daily Bars
Process Weekends
Additional Years of Data
Copyright Trading Blox, LLC 2012. Created on 2015-01-15_09_52_57
3.00%
TRUE
TRUE
FALSE
FALSE
FALSE
TRUE
TRUE
5.00